

lupus
-
Posts
30 -
Joined
-
Last visited
Content Type
Forums
Store
Crowdfunding
Applications
Events
Raffles
Community Map
Posts posted by lupus
-
-
u-boot 17.08.1 flash images for all combinations of Marvell supported CPU/DDR3 frequencies (600/600, 800/800, 1000/800, 1200/750)
With kind support of @Igor and @aldzune I could build and test u-boot 17.08.1 and 17.06.3 flash images for all frequency combinations indicated above (boot snippets 17.08: https://pastebin.com/kKTvP5sx and 17.06: https://pastebin.com/8DZ37Wti , available functions: https://pastebin.com/kN5WBjW9 ).
The flash-image.bin files (
u-boot-images.tar.gz are attached below) just have to be resident in the root directory of a USB stick attached to the Espressobin and they can be flashed at the u-boot prompt:Marvell>> bubt flash-image-XXX_YYY.bin spi usb
(XXX: CPU Frequency, YYY: DDR3 Frequency)
'ARMBIAN 5.32.170817 nightly Debian GNU/Linux 9 (stretch) 4.4.82-mvebu64' boots smoothly in all 4 scenarios (see i.e. https://pastebin.com/KkZsU8sk ). (A static IP address is assigned in /etc/network/interfaces to get rid of the 'raise network interface' issue)
EDIT:
With the new firmware I receive I/O errors after some time while accessing the sd card.
The firmware needs to be properly tested by Marvell / Globalscale Technologies and made available by them.
Please contact Globalscale Technologoies / Marvell if you are interested in a more recent firmware.
-
Openssl speed performance of Espressobin with kernel 4.12.1-ebin and security offload enabled:
Configuraton options used for the kernel are: 'CONFIG_CRYPTO_HW=y' and '# CONFIG_CRYPTO_DEV_MARVELL_CESA is not set'
(CPU frequency is assumed to be 1000MHz, cpufreq support is currently not enabled)
root@ebin:~# cat /proc/version
Linux version 4.12.1-ebin-g4b13ed5-dirty (ubuntu@ebin) (gcc version 6.3.0 20170519 (Ubuntu/Linaro 6.3.0-18ubuntu2~16.04) ) #1 SMP PREEMPT Wed Jul 12 16:25:39 UTC 2017

root@ebin:~# openssl speed -elapsed -evp aes-128-cbc
root@ebin:~# openssl speed -elapsed -evp aes-192-cbc
root@ebin:~# openssl speed -elapsed -evp aes-256-cbc

OpenSSL 1.1.0f  25 May 2017
built on: reproducible build, date unspecified
options:bn(64,64) rc4(char) des(int) aes(partial) blowfish(ptr)
compiler: gcc -DDSO_DLFCN -DHAVE_DLFCN_H -DNDEBUG -DOPENSSL_THREADS -DOPENSSL_NO_STATIC_ENGINE -DOPENSSL_PIC -DOPENSSL_BN_ASM_MONT -DSHA1_ASM -DSHA256_ASM -DSHA512_ASM -DVPAES_ASM -DECP_NISTZ256_ASM -DPOLY1305_ASM -DOPENSSLDIR="\"/usr/lib/ssl\"" -DENGINESDIR="\"/usr/lib/aarch64-linux-gnu/engines-1.1\""
The 'numbers' are in 1000s of bytes per second processed.

combined output:
Espressobin / Marvell 3720 @ 1000MHz:
type             16 bytes    64 bytes     256 bytes    1024 bytes   8192 bytes   16384 bytes
aes-128-cbc      68509.24k   216097.11k   453277.35k   649243.99k   741862.06k   748459.35k
aes-192-cbc      65462.17k   194529.30k   375030.70k   503817.22k   559303.34k   563014.31k
aes-256-cbc      63905.67k   181436.03k   328664.06k   423431.51k   462012.42k   464972.46k
I wonder how the results will change if the Marvell Security Engine is enabled ...
Update:
Please find attached the content of /proc/crypto : https://pastebin.com/ub4J4AiG
-
On 8/17/2017 at 6:32 PM, aldzune said:
It seems to related with Samba.
Netatalk is configured to use the afp protocol - I do not use samba. The networking issue in Ubuntu 16.04. occurs independent of the protocol used to connect to espressobin.
BTW - The new "Armbian_5.32.170817_Espressobin_Debian_stretch_default_4.4.82.7z" image boots from SD ( https://pastebin.com/pHbvcQ39 ). The boot process of Debian stretch is not interrupted by a process for raising network interfaces.
Update:
Espressobin boots Debian stretch from SD with mainline kernel 4.12.1-ebin from @umiddelb (see https://pastebin.com/GXH7fLNF )
The following environment was used: https://pastebin.com/hbYA6p7B
Update2:
The system also boots from ssd ( https://pastebin.com/9KZRK2Cj ).
I used the following environment: https://pastebin.com/mAVY3Hut
The following options need to be used under Debian stretch for formatting the SATA device in order to be accessible by u-boot (thanks to @umiddelb):
sudo mkfs.ext4 -O '^64bit' -O '^metadata_csum' /dev/sdaXUpdate3:
Espressobin still stops responding over the network with 4.12.1-ebin (while Helios LanTest reads data from it) but remains accessible via the console.
-
I have tested kernel 4.4.79-mvebu64 from beta.armbian.com - it runs fine and is rock stable.
Thanks to @umiddleb I have access to mainline kernels for the espressobin - I tried 4.12.1-ebin and 4.13.0-rc4-ebin. They are booting from SD and SATA ( see i.e. https://pastebin.com/jYsrkypw ).
Unfortunately the Helios LanTest
crashesrenders the system on both 4.12 and 4.13 unresponsive. (I have recompiled Netatalk, but to no avail)Could this be related to clock frequencies selected ?Booting the Armbian Ubuntu Image with any kernel is very often interrupted by a job for raising network interfaces: "[** ] A start job is running for Raise ne... interfaces (1min 41s / 5min 4s)". Could this be fixed ?
Update:
As a stability test I compiled squid3 on 4.13.0-rc4-ebin without any problems (both cpus fully loaded for about an hour).
Helios LanTest does not complete since espressobin stops responding over the network but it is still accessible via the console.
Mainline kernels seem to work well, but network interfaces need to be fixed.
Ubuntu 16.04.3 LTS espressobin ttyMV0 espressobin login: root Password: Last login: Mon Aug 14 11:47:57 CEST 2017 on ttyMV0 _____ _ _ | ____|___ _ __ _ __ ___ ___ ___ ___ | |__ (_)_ __ | _| / __| '_ \| '__/ _ \/ __/ __|/ _ \| '_ \| | '_ \ | |___\__ \ |_) | | | __/\__ \__ \ (_) | |_) | | | | | |_____|___/ .__/|_| \___||___/___/\___/|_.__/|_|_| |_| |_| Welcome to ARMBIAN 5.32 user-built Ubuntu 16.04.3 LTS 4.13.0-rc4-ebin-130271-gabe3c92 System load: 0.04 0.18 0.14 Up time: 8 min Memory usage: 16 % of 992MB IP: 192.168.240.42 HDD temp: 30??C Usage of /: 5% of 110G storage/: 5% of 110G [ General system configuration: armbian-config ] root@espressobin:~# ping google.com ping: unknown host google.com -
I am using tkaisers image http://kaiser-edv.de/tmp/NumpU8/Armbian_5.32_Espressobin_Ubuntu_xenial_default_4.4.78.7z - updated with apt-get update && apt-get upgrade (powersave enabled - no cpufreq available).
With an ambient temperature of 26 degrees Celsius, the temperature of the marvell 3720 is 50 degrees (steady state, measured after 10 minutes with an infrared thermometer), idle power consumption is 3.7W now ! The hottest chip (60 degrees) is the small one next to the 3720 with the label "U5" next to it.
50 degrees is far to hot to touch but should be OK for the silicon.
Please find attached the output of armbianmonitor -u: http://sprunge.us/CWFi
-
The update worked for me using apt-get update && apt-get upgrade.
Power consumption went up to 4.5 W due to powersave instead of ondemand. Helios LanTest results are OK (test run on 28.07.)
The issue reported by tom_i seems to be related to the wifi card "Modules linked in: mwifiex_pcie mwifiex cfg80211 rfkill".
Did you try to boot without the wifi card ?
-
Regarding potential thermal issues: There would not appear to be any.
I checked the temperature of the Marvell 3720 using an infrared thermometer while at the Marvell>> prompt in U-boot. The chip reached a steady state temperature of 55 degrees Celsius within 10 minutes (ambient temperature 25 degrees Celsius). Power consumption of espressobin is about 5W in this context.
Then I did boot Armbian_5.32.170626_Espressobin_Ubuntu_xenial_default_4.4.73.7z and within the first 10 minutes the 3720 reached a steady state temperature of 45 degrees Celsius (idle, ondemand, CPU frequency 200MHz). The power consumption in this context is about 3.5 W (can probably be further reduced my managing eth phy).
Although these values were measured at the outside (not core temperatures), they would not appear to be problematic at all.
According to Globalscaletechnologies, even core temperatures around 65 - 73 degrees Celsius (idle) would be considered normal. They observe these core temperatures in U-boot and on buildroot OS (idle).
I conclude, that Armbian does already better due to cpu frequency scaling.
BTW - I could not find any direct thermal monitoring in /sys/...
-
6 hours ago, tkaiser said:
I was not able to get a full serial connection (maybe my board is broken) and IMO it's better to avoid such hassles if possible.
My board also started to overheat at the u-boot prompt - but after the environment variables were correctly set it could boot Armbian_5.32.170626_Espressobin_Ubuntu_xenial_default_4.4.73.7z and the thermal issues were gone after that.
Please send a PM in case you wish to replace your board.
-
3 minutes ago, zador.blood.stained said:
Can you please provide output of "help" too?
Marvell>> help ? - alias for 'help' base - print or set address offset bdinfo - print Board Info structure boot - boot default, i.e., run 'bootcmd' bootd - boot default, i.e., run 'bootcmd' bootelf - Boot from an ELF image in memory booti - boot arm64 Linux Image image from memory bootm - boot application image from memory bootp - boot image via network using BOOTP/TFTP protocol bootvx - Boot vxWorks from an ELF image bubt - Burn a u-boot image to flash cmp - memory compare cp - memory copy crc32 - checksum calculation echo - echo args to console editenv - edit environment variable env - environment handling commands exit - exit script ext2load- load binary file from a Ext2 filesystem ext2ls - list files in a directory (default /) ext4load- load binary file from a Ext4 filesystem ext4ls - list files in a directory (default /) ext4size- determine a file's size ext4write- create a file in the root directory false - do nothing, unsuccessfully fatinfo - print information about filesystem fatload - load binary file from a dos filesystem fatls - list files in a directory (default /) fatsize - determine a file's size fdt - flattened device tree utility commands fsinfo - print information about filesystems fsload - load binary file from a filesystem image go - start application at address 'addr' gpio - query and control gpio pins help - print command description/usage i2c - I2C sub-system ir - ir - Reading and changing internal register values. loop - infinite loop on address range ls - list files in a directory (default /) map - Display address decode windows md - memory display mdio - MDIO utility commands mii - MII utility commands mm - memory modify (auto-incrementing address) mmc - MMC sub system mmcinfo - display MMC info mw - memory write (fill) nm - memory modify (constant address) pci - list and access PCI Configuration Space ping - send ICMP ECHO_REQUEST to network host printenv- print environment variables remap - Remap the output address of a window reset - Perform RESET of the CPU resetenv- resetenv - reset all variables to default run - run commands in an environment variable saveenv - save environment variables to persistent storage scsi - SCSI sub-system scsiboot- boot from SCSI device setenv - set environment variables sf - SPI flash sub-system showvar - print local hushshell variables sleep - delay execution for some time sspi - SPI utility command test - minimal test like /bin/sh tftpboot- boot image via network using TFTP protocol true - do nothing, successfully usb - USB sub-system usbboot - boot from USB device version - print monitor, compiler and linker version Marvell>> -
Unfortunately espressobin does not find the boot image (I am trying OMV_3_0_85_ESPRESSOBin_4.12.0.7z) even if the environtment variables given in https://github.com/armbian/build/blob/master/config/bootscripts/boot-espressobin.cmd are used:
Hit any key to stop autoboot:  0
switch to partitions #0, OK
mmc0 is current device
** File not found boot/Image **
4803565 bytes read in 1749 ms (2.6 MiB/s)
** File not found boot/dtb/marvell/armada-3720-community.dtb **
Bad Linux ARM64 Image magic!
Marvell>>
Please find attached the current environment:
Marvell>> printenv baudrate=115200 boot_interface=mmc bootargs=console=ttyMV0,115200 earlycon=ar3700_uart,0xd0012000 root=/dev/mmcblk0p1 rw rootwait bootcmd=mmc dev 0; ext4load mmc 0:1 $kernel_addr $image_name;ext4load mmc 0:1 $initrd_addr $initrd_image; ext4load mmc 0:1 $fdt_addr $fdt_name;setenv bootargs $console root=$rootdev rw rootwait; booti $kernel_ar bootdelay=3 bootmmc=mmc dev 0; ext4load mmc 0:1 $kernel_addr $image_name;ext4load mmc 0:1 $fdt_addr $fdt_name;setenv bootargs $console root=/dev/mmcblk0p1 rw rootwait; booti $kernel_addr - $fdt_addr console=console=ttyMV0,115200 earlycon=ar3700_uart,0xd0012000 eth1addr=00:00:00:00:51:82 eth2addr=00:00:00:00:51:83 ethact=neta0 ethaddr=F0:AD:4E:03:69:D0 ethprime=egiga0 fdt_addr=0x1000000 fdt_high=0xffffffffffffffff fdt_name=boot/dtb/marvell/armada-3720-community.dtb filesize=494bed gatewayip=10.4.50.254 get_images=mmc dev 0; fatload mmc 0 $kernel_addr $image_name; fatload mmc 0 $fdt_addr $fdt_name; run get_ramfs get_ramfs=if test "${ramfs_name}" != "-"; then setenv ramfs_addr 0x3000000; tftp $ramfs_addr $ramfs_name; else setenv ramfs_addr -;fi hostname=marvell image_name=boot/Image initrd_addr=0x1100000 initrd_image=boot/uInitrd initrd_size=0x2000000 ipaddr=192.168.240.42 kernel_addr=0x2000000 loadaddr=0x2000000 loads_echo=0 netdev=eth0 netmask=255.255.255.0 ramfs_addr=- ramfs_name=- root=root=/dev/mmcblk0p1 rw rootdev=/dev/mmcblk0p1 rootfstype=ext4 rootpath=/srv/nfs/ serverip=0.0.0.0 set_bootargs=setenv bootargs $console $root stderr=serial stdin=serial stdout=serial verbosity=1 Environment size: 1650/65532 bytes Marvell>> -
4 minutes ago, tkaiser said:
But now stuck at u-boot prompt:
Did you set the the environment parameters of espressobin (after Marvell>>) according to https://github.com/armbian/build/blob/master/config/bootscripts/boot-espressobin.cmd ?
In particular "setenv fdt_name boot/dtb/marvell/armada-3720-community.dtb" needs to be set, since "boot/armada-3720-community.dtb" does not exist.
-
8 hours ago, stickman said:
could you please test the script I linked to in my post to check if there is any improvement?
The script uses devmem - such a binary is not part of the Ubuntu image. I compiled devmem2 from gitgub sources (https://github.com/pavel-a/devmemX).
The output of the adapted script unfortunately just produced a bunch of segmentation faults ...
-
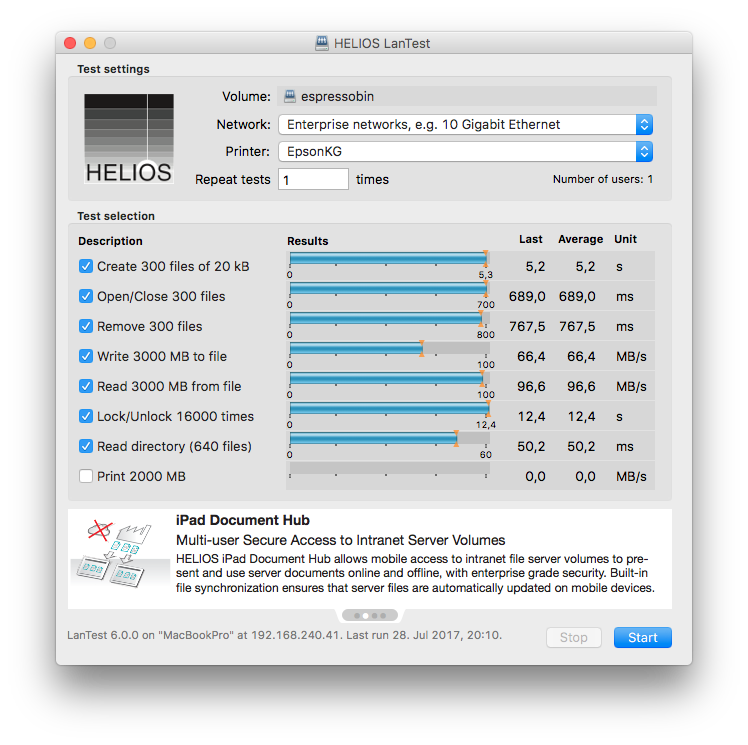
Workaround (as suggested by tkaiser): I stored the following two lines in /etc/rc.local - after a reboot ondemand governor switches between 200MHz (!) and 1GHz depending on system load:
cpufreq-set -c 0 -d 500000 -u 1000000 -g ondemand
cpufreq-set -c 1 -d 500000 -u 1000000 -g ondemand

root@espressobin:~# armbianmonitor -m
Stop monitoring using [ctrl]-[c]
Time        CPU    load %cpu %sys %usr %nice %io %irq
11:12:27: 1000MHz  0.43  32%  10%  19%   0%   3%   0%
11:12:32:  200MHz  0.40  29%   9%  17%   0%   2%   0%
11:12:37:  200MHz  0.37  27%   8%  16%   0%   2%   0%
11:12:42:  200MHz  0.34  25%   8%  14%   0%   2%   0%
11:12:47:  200MHz  0.31  24%   7%  14%   0%   2%   0%
11:12:52:  200MHz  0.28  22%   7%  13%   0%   2%   0%
11:12:57:  200MHz  0.26  21%   6%  12%   0%   1%   0%
11:13:02:  200MHz  0.24  20%   6%  11%   0%   1%   0%
11:13:07: 1000MHz  0.22  19%   6%  11%   0%   1%   0%
11:13:12: 1000MHz  0.20  19%   6%  10%   0%   1%   0%
11:13:17:  200MHz  0.19  18%   6%  10%   0%   1%   0%
11:13:22:  200MHz  0.17  17%   6%   9%   0%   1%   0%
11:13:27:  200MHz  0.16  16%   5%   9%   0%   1%   0%
11:13:32:  200MHz  0.14  15%   5%   8%   0%   1%   0%
iperf3 results are now both fine:
MacBookPro:~ lupus$ iperf3 -c 192.168.240.42
Connecting to host 192.168.240.42, port 5201
[  4] local 192.168.240.41 port 58907 connected to 192.168.240.42 port 5201
[ ID] Interval           Transfer     Bandwidth
[  4]   0.00-1.00   sec  68.9 MBytes   578 Mbits/sec
[  4]   1.00-2.00   sec   103 MBytes   862 Mbits/sec
[  4]   2.00-3.00   sec   105 MBytes   882 Mbits/sec
[  4]   3.00-4.00   sec   104 MBytes   876 Mbits/sec
[  4]   4.00-5.00   sec   102 MBytes   851 Mbits/sec
[  4]   5.00-6.00   sec   106 MBytes   892 Mbits/sec
[  4]   6.00-7.00   sec   102 MBytes   860 Mbits/sec
[  4]   7.00-8.00   sec   106 MBytes   892 Mbits/sec
[  4]   8.00-9.00   sec   105 MBytes   882 Mbits/sec
[  4]   9.00-10.00  sec   104 MBytes   876 Mbits/sec
- - - - - - - - - - - - - - - - - - - - - - - - -
[ ID] Interval           Transfer     Bandwidth
[  4]   0.00-10.00  sec  1007 MBytes   845 Mbits/sec                  sender
[  4]   0.00-10.00  sec  1004 MBytes   842 Mbits/sec                  receiver

iperf Done.
MacBookPro:~ lupus$ iperf3 -R -c 192.168.240.42
Connecting to host 192.168.240.42, port 5201
Reverse mode, remote host 192.168.240.42 is sending
[  4] local 192.168.240.41 port 58911 connected to 192.168.240.42 port 5201
[ ID] Interval           Transfer     Bandwidth
[  4]   0.00-1.00   sec   111 MBytes   933 Mbits/sec
[  4]   1.00-2.00   sec   111 MBytes   932 Mbits/sec
[  4]   2.00-3.00   sec   112 MBytes   937 Mbits/sec
[  4]   3.00-4.00   sec   112 MBytes   937 Mbits/sec
[  4]   4.00-5.00   sec   112 MBytes   936 Mbits/sec
[  4]   5.00-6.00   sec   112 MBytes   937 Mbits/sec
[  4]   6.00-7.00   sec   112 MBytes   936 Mbits/sec
[  4]   7.00-8.00   sec   112 MBytes   936 Mbits/sec
[  4]   8.00-9.00   sec   112 MBytes   936 Mbits/sec
[  4]   9.00-10.00  sec   111 MBytes   935 Mbits/sec
- - - - - - - - - - - - - - - - - - - - - - - - -
[ ID] Interval           Transfer     Bandwidth       Retr
[  4]   0.00-10.00  sec  1.09 GBytes   939 Mbits/sec    0             sender
[  4]   0.00-10.00  sec  1.09 GBytes   939 Mbits/sec                  receiver

iperf Done.
Helios LanTest write performance is good too:
-
2 hours ago, tkaiser said:
@lupusThanks a lot for the detailled and correct testing. Currently the lowest allowed clockspeed in /etc/defaults/cpufrequtils is just 200 MHz. It would be interesting to lift this to 400 or even 500 MHz there (I'm too lazy to search for but with ASUS Tinkerboard default cpufreq settings allowed the board to downclock to 126MHz which totally destroys IO performance with ondemand governor, lifting it to 600 MHz allowed the ondemand algorithm working way better).
There are only specific frequencies supported with the current system:
root@espressobin:~# cat /sys/devices/system/cpu/cpu0/cpufreq/scaling_available_frequencies
200000 250000 500000 1000000
However, cpufrequtils is currently configured to use another maximum value:
root@espressobin:~# cat /etc/default/cpufrequtils
ENABLE=true
MIN_SPEED=200000
MAX_SPEED=800000
GOVERNOR=ondemand
I have changed MAX_SPEED to 1000000 but unfortunately espressobin does not boot reliably anymore (crashes upon login).
2 hours ago, tkaiser said:I ordered an ESPRESSOBin myself which might get shipped soon
I have received my order of 10 espressobin this week ($49 each plus shipping) - I still have 7 to give away for the price I have paid. I have sent to you a PM with my contact details in any case ...
-
4 hours ago, tkaiser said:
I would say as expected if you ran at the same time just an iperf3 benchmark. But when a combined load like LanTest (or any real-world NAS access) happens ondemand should ramp up clockspeeds immediately. So what I wanted to see is shitty iperf numbers and great LanTest scores
")
Unfortunately the ondemand tweak does not ramp up clockspeeds upon heavy loads. Please find below the armbianmonitor -m output collected during the Helios LanTest (also attached below):
root@espressobin:~# armbianmonitor -m
Stop monitoring using [ctrl]-[c]
Time        CPU    load %cpu %sys %usr %nice %io %irq
21:32:57:  200MHz  0.07   9%   5%   2%   0%   0%   0%
21:33:02:  200MHz  0.07   9%   5%   2%   0%   0%   0%
21:33:07:    0MHz  0.06   9%   5%   2%   0%   0%   0%
21:33:12:    0MHz  0.06   9%   5%   2%   0%   0%   0%
21:33:18:  200MHz  0.05   9%   5%   2%   0%   0%   0%
21:33:23:  200MHz  0.13   9%   5%   2%   0%   0%   0%
21:33:28:  200MHz  0.12   9%   5%   2%   0%   0%   1%
21:33:33:  200MHz  0.11   9%   5%   2%   0%   0%   1%
21:33:38:  200MHz  0.10  10%   5%   2%   0%   0%   1%
21:33:43:  200MHz  0.09  10%   6%   2%   0%   0%   1%
21:33:48:  200MHz  0.24  10%   6%   2%   0%   0%   1%
21:33:53:  200MHz  0.30  10%   6%   2%   0%   0%   1%
21:33:59:  200MHz  0.44  10%   6%   2%   0%   0%   1%
21:34:04:  200MHz  0.41  11%   6%   2%   0%   0%   1%
Time        CPU    load %cpu %sys %usr %nice %io %irq
21:34:09:  200MHz  0.85  11%   6%   2%   0%   0%   1%
21:34:14:    0MHz  0.79  11%   6%   2%   0%   0%   1%
21:34:19:  200MHz  0.80  11%   7%   2%   0%   0%   1%
21:34:24:  200MHz  0.74  11%   7%   2%   0%   0%   1%
21:34:29:  200MHz  0.76  11%   7%   2%   0%   0%   1%
21:34:35:  200MHz  0.70  12%   7%   2%   0%   0%   1%
21:34:40:  200MHz  0.80  12%   7%   2%   0%   0%   1%
21:34:45:  200MHz  0.82  12%   7%   2%   0%   0%   1%
21:34:50:  200MHz  0.83  12%   7%   2%   0%   0%   1%
21:34:55:  200MHz  0.85  13%   8%   2%   0%   0%   2%
21:35:00:  200MHz  0.86  13%   8%   2%   0%   0%   2%
21:35:05:  200MHz  0.87  13%   8%   2%   0%   0%   2%
21:35:10:  200MHz  0.96  13%   8%   2%   0%   0%   2%
21:35:16:  200MHz  0.97  13%   8%   2%   0%   0%   2%
21:35:21:  200MHz  0.89  13%   8%   2%   0%   0%   2%
Time        CPU    load %cpu %sys %usr %nice %io %irq
21:35:26:  200MHz  0.90  13%   8%   2%   0%   0%   2%
21:35:31:  200MHz  0.82  13%   8%   2%   0%   0%   2%
21:35:36:  200MHz  0.84  13%   8%   2%   0%   0%   2%
21:35:41:  200MHz  0.85  14%   8%   2%   0%   0%   2%
21:35:46:  200MHz  0.86  14%   8%   2%   0%   0%   2%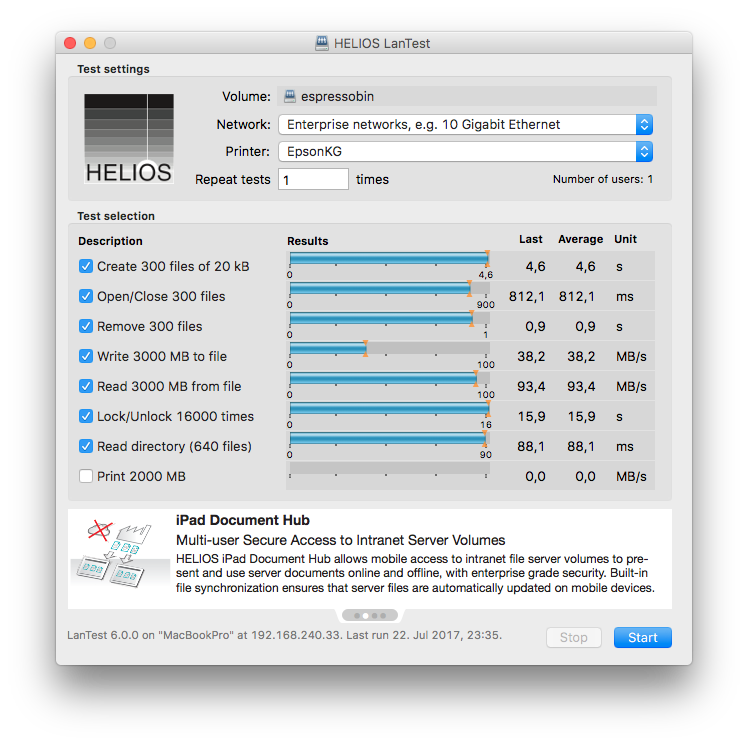
-
16 minutes ago, tkaiser said:
I would say as expected if you ran at the same time just an iperf3 benchmark. But when a combined load like LanTest (or any real-world NAS access) happens ondemand should ramp up clockspeeds immediately. So what I wanted to see is shitty iperf numbers and great LanTest scores
So after applying the patch to armhwinfo I get the following results (while running iperf3):
root@espressobin:~# armbianmonitor -m
Stop monitoring using [ctrl]-[c]
Time        CPU    load %cpu %sys %usr %nice %io %irq
17:32:29:  200MHz  0.13  16%   8%   3%   0%   1%   2%
17:32:34:  200MHz  0.12  16%   8%   3%   0%   1%   2%
17:32:40:  200MHz  0.11  16%   8%   3%   0%   1%   2%
17:32:45:  200MHz  0.18  16%   8%   3%   0%   1%   2%
17:32:50:  200MHz  0.17  16%   8%   3%   0%   1%   2%
17:32:55:  200MHz  0.15  16%   8%   3%   0%   1%   2%

MacPro:~ admin$ iperf3 -c 192.168.240.42
Connecting to host 192.168.240.42, port 5201
[  5] local 192.168.240.36 port 49665 connected to 192.168.240.42 port 5201
[ ID] Interval           Transfer     Bitrate
[  5]   0.00-1.00   sec  4.91 MBytes  41.1 Mbits/sec
[  5]   1.00-2.00   sec  51.5 MBytes   432 Mbits/sec
[  5]   2.00-3.00   sec  62.2 MBytes   522 Mbits/sec
[  5]   3.00-4.00   sec  56.9 MBytes   478 Mbits/sec
[  5]   4.00-5.00   sec  45.5 MBytes   381 Mbits/sec
[  5]   5.00-6.00   sec  47.4 MBytes   398 Mbits/sec
[  5]   6.00-7.00   sec  52.0 MBytes   436 Mbits/sec
[  5]   7.00-8.00   sec  47.0 MBytes   394 Mbits/sec
[  5]   8.00-9.00   sec  46.0 MBytes   386 Mbits/sec
[  5]   9.00-10.00  sec  53.9 MBytes   452 Mbits/sec
- - - - - - - - - - - - - - - - - - - - - - - - -
[ ID] Interval           Transfer     Bitrate
[  5]   0.00-10.00  sec   467 MBytes   392 Mbits/sec                  sender
[  5]   0.00-10.00  sec   466 MBytes   391 Mbits/sec                  receiver

iperf Done.
MacPro:~ admin$ iperf3 -R -c 192.168.240.42
Connecting to host 192.168.240.42, port 5201
Reverse mode, remote host 192.168.240.42 is sending
[  5] local 192.168.240.36 port 49668 connected to 192.168.240.42 port 5201
[ ID] Interval           Transfer     Bitrate
[  5]   0.00-1.00   sec   111 MBytes   933 Mbits/sec
[  5]   1.00-2.00   sec   111 MBytes   931 Mbits/sec
[  5]   2.00-3.00   sec   112 MBytes   937 Mbits/sec
[  5]   3.00-4.00   sec   112 MBytes   937 Mbits/sec
[  5]   4.00-5.00   sec   112 MBytes   937 Mbits/sec
[  5]   5.00-6.00   sec   112 MBytes   937 Mbits/sec
[  5]   6.00-7.00   sec   111 MBytes   934 Mbits/sec
[  5]   7.00-8.00   sec   111 MBytes   931 Mbits/sec
[  5]   8.00-9.00   sec   112 MBytes   937 Mbits/sec
[  5]   9.00-10.00  sec   112 MBytes   937 Mbits/sec
- - - - - - - - - - - - - - - - - - - - - - - - -
[ ID] Interval           Transfer     Bitrate         Retr
[  5]   0.00-10.00  sec  1.09 GBytes   938 Mbits/sec    0             sender
[  5]   0.00-10.00  sec  1.09 GBytes   935 Mbits/sec                  receiver

iperf Done.
Helios LanTest still produces low write speed in this context:
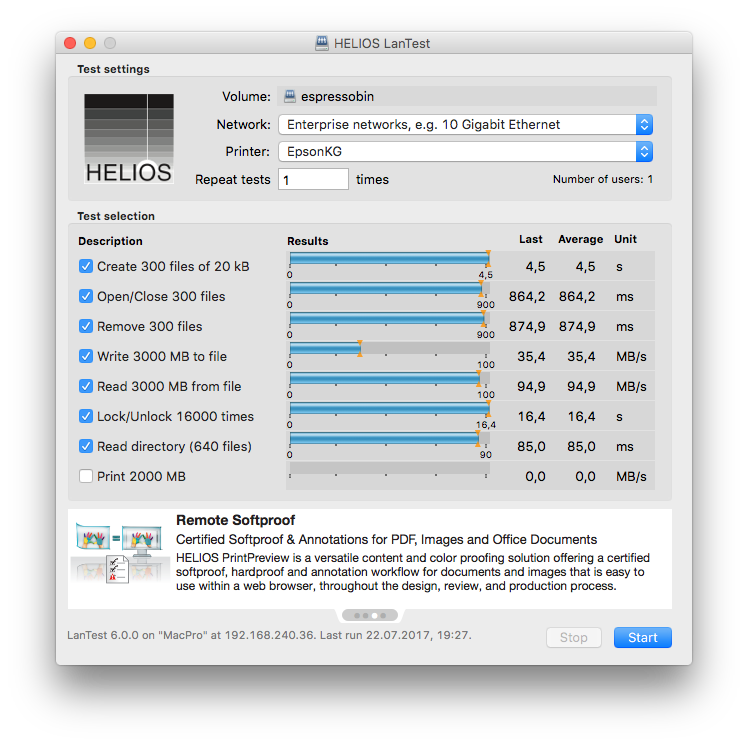
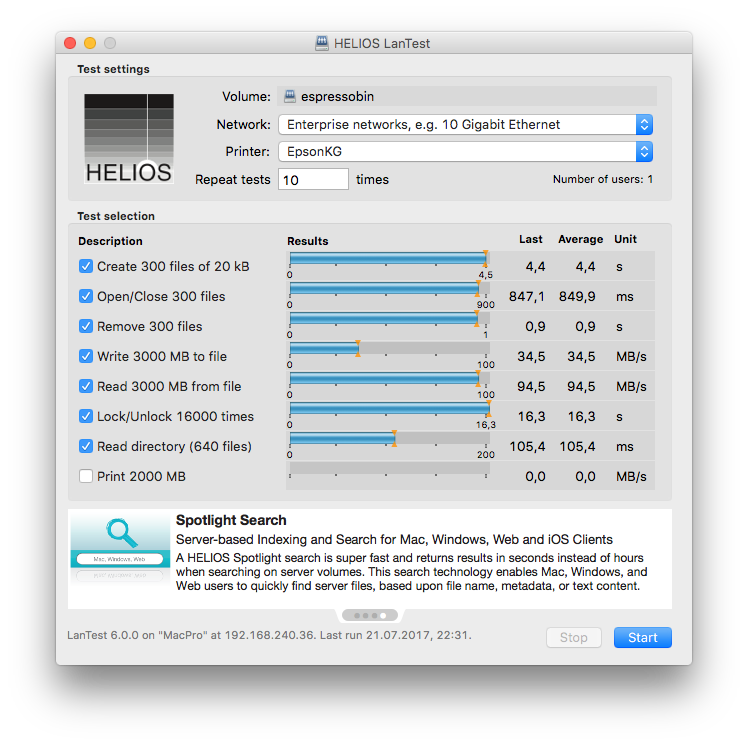
Then I manually set CPU frequencies to 1GHz and obtained the following results (while running iperf3):
root@espressobin:~# armbianmonitor -m
Stop monitoring using [ctrl]-[c]
Time        CPU    load %cpu %sys %usr %nice %io %irq
17:39:51: 1000MHz  0.02  10%   5%   2%   0%   1%   1%
17:39:56: 1000MHz  0.02  10%   5%   2%   0%   1%   1%
17:40:01: 1000MHz  0.10  10%   5%   2%   0%   1%   1%
17:40:06: 1000MHz  0.17  10%   5%   2%   0%   1%   2%
17:40:11: 1000MHz  0.16  10%   5%   2%   0%   0%   2%
17:40:16: 1000MHz  0.14  10%   5%   2%   0%   0%   2%

MacPro:~ admin$ iperf3 -c 192.168.240.42
Connecting to host 192.168.240.42, port 5201
[  5] local 192.168.240.36 port 49684 connected to 192.168.240.42 port 5201
[ ID] Interval           Transfer     Bitrate
[  5]   0.00-1.00   sec  74.6 MBytes   626 Mbits/sec
[  5]   1.00-2.00   sec  76.7 MBytes   643 Mbits/sec
[  5]   2.00-3.00   sec  79.5 MBytes   667 Mbits/sec
[  5]   3.00-4.00   sec   101 MBytes   850 Mbits/sec
[  5]   4.00-5.00   sec   108 MBytes   905 Mbits/sec
[  5]   5.00-6.00   sec   104 MBytes   871 Mbits/sec
[  5]   6.00-7.00   sec   102 MBytes   858 Mbits/sec
[  5]   7.00-8.00   sec   104 MBytes   873 Mbits/sec
[  5]   8.00-9.00   sec   102 MBytes   857 Mbits/sec
[  5]   9.00-10.00  sec   105 MBytes   883 Mbits/sec
- - - - - - - - - - - - - - - - - - - - - - - - -
[ ID] Interval           Transfer     Bitrate
[  5]   0.00-10.00  sec   958 MBytes   803 Mbits/sec                  sender
[  5]   0.00-10.00  sec   956 MBytes   802 Mbits/sec                  receiver

iperf Done.
MacPro:~ admin$ iperf3 -R -c 192.168.240.42
Connecting to host 192.168.240.42, port 5201
Reverse mode, remote host 192.168.240.42 is sending
[  5] local 192.168.240.36 port 49687 connected to 192.168.240.42 port 5201
[ ID] Interval           Transfer     Bitrate
[  5]   0.00-1.00   sec   112 MBytes   936 Mbits/sec
[  5]   1.00-2.00   sec   111 MBytes   932 Mbits/sec
[  5]   2.00-3.00   sec   112 MBytes   937 Mbits/sec
[  5]   3.00-4.00   sec   111 MBytes   932 Mbits/sec
[  5]   4.00-5.00   sec   112 MBytes   937 Mbits/sec
[  5]   5.00-6.00   sec   111 MBytes   933 Mbits/sec
[  5]   6.00-7.00   sec   112 MBytes   937 Mbits/sec
[  5]   7.00-8.00   sec   111 MBytes   930 Mbits/sec
[  5]   8.00-9.00   sec   112 MBytes   937 Mbits/sec
[  5]   9.00-10.00  sec   110 MBytes   926 Mbits/sec
- - - - - - - - - - - - - - - - - - - - - - - - -
[ ID] Interval           Transfer     Bitrate         Retr
[  5]   0.00-10.00  sec  1.09 GBytes   937 Mbits/sec    0             sender
[  5]   0.00-10.00  sec  1.09 GBytes   937 Mbits/sec                  receiver

iperf Done.
In this context Helios LanTest results are also pretty nice ...
-
18 minutes ago, tkaiser said:
Can you please check contents of /etc/init.d/armhwinfo for this: https://github.com/armbian/build/blob/4e04879249361f7f38117b82a12d1cf0c4969306/packages/bsp/armhwinfo#L90-L102
I moved this just recently from Armbian's OMV installation routine to armhwinfo so it might not be active on any image so far. It would be great if you can check. If it's not active then activate this manually and then repost results of iperf3 and LanTest benchmarks. Thank you!
")
I have checked /etc/init.d/armhwinfo for your patch. It was not there so I copied it into armhwinfo.
After a reboot the ondemand governor still does not scale up (see below) - I am currently compiling netatalk again, CPU freq is 200MHz and the load is up to 2.05 ...
root@espressobin:~# armbianmonitor -m Stop monitoring using [ctrl]-[c] Time CPU load %cpu %sys %usr %nice %io %irq 16:51:07: 200MHz 1.92 73% 8% 63% 0% 0% 0% 16:51:12: 200MHz 1.85 73% 8% 63% 0% 0% 0% 16:51:17: 200MHz 1.78 73% 8% 63% 0% 0% 0% 16:51:22: 200MHz 1.80 73% 8% 63% 0% 0% 0% 16:51:27: 200MHz 1.81 73% 8% 63% 0% 0% 0% 16:51:32: 200MHz 1.83 73% 8% 64% 0% 0% 0% 16:51:37: 200MHz 1.84 74% 8% 64% 0% 0% 0% 16:51:42: 200MHz 1.85 74% 8% 64% 0% 0% 0% 16:51:47: 200MHz 1.79 74% 8% 64% 0% 0% 0% 16:51:53: 200MHz 1.80 74% 8% 64% 0% 0% 0% 16:51:58: 200MHz 2.06 74% 8% 65% 0% 0% 0% 16:52:03: 200MHz 2.05 75% 8% 65% 0% 0% 0% 16:52:08: 200MHz 2.05 75% 8% 65% 0% 0% 0% 16:52:13: 200MHz 2.05 75% 8% 65% 0% 0% 0% -
The puzzle seems to be solved - the ondemand governor does not scale up the cpu frequencies as expected.
Armbianmonitor -m always displays a maximum of 200MHz as the current cpu frequency:
root@espressobin:~# armbianmonitor -m
Stop monitoring using [ctrl]-[c]
Time        CPU    load %cpu %sys %usr %nice %io %irq
15:26:36:  200MHz  0.16  13%   3%   9%   0%   0%   0%
15:26:41:    0MHz  0.14  13%   3%   9%   0%   0%   0%
15:26:46:  200MHz  0.13  13%   3%   9%   0%   0%   0%
15:26:51:  200MHz  0.20  13%   3%   9%   0%   0%   0%
15:26:56:    0MHz  0.39  14%   3%   9%   0%   0%   1%
15:27:01:    0MHz  0.36  14%   3%   9%   0%   0%   1%
15:27:07:  200MHz  0.41  14%   3%   9%   0%   0%   1%
15:27:12:  200MHz  0.38  14%   3%   9%   0%   0%   1%
15:27:17:  200MHz  0.35  14%   3%   9%   0%   0%   1%
15:27:22:    0MHz  0.32  14%   3%   9%   0%   0%   1%
15:27:27:  200MHz  0.29  14%   3%   8%   0%   0%   1%
15:27:32:  200MHz  0.27  14%   3%   8%   0%   0%   1%
Manually setting the frequency of both cpus to 1GHz leads to expected results of iperf3:
root@espressobin:~# cpufreq-set -c 1 -d 1000000 -u 1000000 -g performance root@espressobin:~# cpufreq-set -c 0 -d 1000000 -u 1000000 -g performance root@espressobin:~# armbianmonitor -m Stop monitoring using [ctrl]-[c] Time CPU load %cpu %sys %usr %nice %io %irq 15:38:48: 1000MHz 0.15 8% 2% 3% 0% 0% 1% 15:38:53: 1000MHz 0.13 8% 2% 3% 0% 0% 1% 15:38:58: 1000MHz 0.12 7% 2% 3% 0% 0% 1% 15:39:04: 1000MHz 0.19 8% 2% 3% 0% 0% 1% 15:39:09: 1000MHz 0.26 8% 2% 3% 0% 0% 1% 15:39:14: 1000MHz 0.24 8% 2% 3% 0% 0% 1% MacBookPro: admin$ iperf3 -c 192.168.240.42 Connecting to host 192.168.240.42, port 5201 [ 4] local 192.168.240.41 port 49642 connected to 192.168.240.42 port 5201 [ ID] Interval Transfer Bandwidth [ 4] 0.00-1.00 sec 73.5 MBytes 616 Mbits/sec [ 4] 1.00-2.00 sec 110 MBytes 920 Mbits/sec [ 4] 2.00-3.00 sec 108 MBytes 904 Mbits/sec [ 4] 3.00-4.00 sec 105 MBytes 881 Mbits/sec [ 4] 4.00-5.00 sec 105 MBytes 881 Mbits/sec [ 4] 5.00-6.00 sec 104 MBytes 874 Mbits/sec [ 4] 6.00-7.00 sec 106 MBytes 885 Mbits/sec [ 4] 7.00-8.00 sec 106 MBytes 885 Mbits/sec [ 4] 8.00-9.00 sec 106 MBytes 886 Mbits/sec [ 4] 9.00-10.00 sec 103 MBytes 867 Mbits/sec - - - - - - - - - - - - - - - - - - - - - - - - - [ ID] Interval Transfer Bandwidth [ 4] 0.00-10.00 sec 1.00 GBytes 860 Mbits/sec sender [ 4] 0.00-10.00 sec 1.00 GBytes 860 Mbits/sec receiver iperf Done. MacBookPro: admin$ iperf3 -R -c 192.168.240.42 Connecting to host 192.168.240.42, port 5201 Reverse mode, remote host 192.168.240.42 is sending [ 4] local 192.168.240.41 port 49645 connected to 192.168.240.42 port 5201 [ ID] Interval Transfer Bandwidth [ 4] 0.00-1.00 sec 111 MBytes 933 Mbits/sec [ 4] 1.00-2.00 sec 112 MBytes 936 Mbits/sec [ 4] 2.00-3.00 sec 112 MBytes 937 Mbits/sec [ 4] 3.00-4.00 sec 112 MBytes 937 Mbits/sec [ 4] 4.00-5.00 sec 112 MBytes 937 Mbits/sec [ 4] 5.00-6.00 sec 112 MBytes 937 Mbits/sec [ 4] 6.00-7.00 sec 112 MBytes 937 Mbits/sec [ 4] 7.00-8.00 sec 112 MBytes 936 Mbits/sec [ 4] 8.00-9.00 sec 112 MBytes 936 Mbits/sec [ 4] 9.00-10.00 sec 112 MBytes 937 Mbits/sec - - - - - - - - - - - - - - - - - - - - - - - - - [ ID] Interval Transfer Bandwidth Retr [ 4] 0.00-10.00 sec 1.09 GBytes 939 Mbits/sec 0 sender [ 4] 0.00-10.00 sec 1.09 GBytes 936 Mbits/sec receiver iperf Done. -
Following up on my previous post: SSD read and write performance is above 200MB/s - can not be the reason for slow write performance.
root@espressobin:~# hdparm -tT /dev/sda
/dev/sda:
 Timing cached reads:   1128 MB in  2.00 seconds = 563.38 MB/sec
 Timing buffered disk reads: 678 MB in  3.01 seconds = 225.51 MB/sec

root@espressobin:~# hdparm -tT --direct /dev/sda
/dev/sda:
 Timing O_DIRECT cached reads:   414 MB in  2.00 seconds = 206.64 MB/sec
 Timing O_DIRECT disk reads: 634 MB in  3.01 seconds = 210.87 MB/sec

root@espressobin:~# dd if=/dev/zero of=/mnt/ssd/var/cloud/afp/tempfile bs=1M count=1024 conv=fdatasync,notrunc
1024+0 records in
1024+0 records out
1073741824 bytes (1.1 GB, 1.0 GiB) copied, 5.11181 s, 210 MB/s

root@espressobin:~# echo 3 | sudo tee /proc/sys/vm/drop_caches
3

root@espressobin:~# dd if=/mnt/ssd/var/cloud/afp/tempfile of=/dev/null bs=1M count=1024
1024+0 records in
1024+0 records out
1073741824 bytes (1.1 GB, 1.0 GiB) copied, 3.90237 s, 275 MB/s
iperf3 results reveal that the network is fine, but that there are issues if espressobin receives data:
MacPro:~ admin$ iperf3  -c 192.168.240.42
Connecting to host 192.168.240.42, port 5201
[  5] local 192.168.240.36 port 49537 connected to 192.168.240.42 port 5201
[ ID] Interval           Transfer     Bitrate
[  5]   0.00-1.00   sec  27.6 MBytes   232 Mbits/sec
[  5]   1.00-2.00   sec  43.4 MBytes   364 Mbits/sec
[  5]   2.00-3.00   sec  45.8 MBytes   384 Mbits/sec
[  5]   3.00-4.00   sec  45.2 MBytes   379 Mbits/sec
[  5]   4.00-5.00   sec  47.0 MBytes   394 Mbits/sec
[  5]   5.00-6.00   sec  45.5 MBytes   382 Mbits/sec
[  5]   6.00-7.00   sec  45.4 MBytes   380 Mbits/sec
[  5]   7.00-8.00   sec  46.2 MBytes   387 Mbits/sec
[  5]   8.00-9.00   sec  48.4 MBytes   405 Mbits/sec
[  5]   9.00-10.00  sec  48.4 MBytes   407 Mbits/sec
- - - - - - - - - - - - - - - - - - - - - - - - -
[ ID] Interval           Transfer     Bitrate
[  5]   0.00-10.00  sec   443 MBytes   371 Mbits/sec                  sender
[  5]   0.00-10.00  sec   442 MBytes   371 Mbits/sec                  receiver

iperf Done.
MacPro:~ admin$ iperf3 -R  -c 192.168.240.42
Connecting to host 192.168.240.42, port 5201
Reverse mode, remote host 192.168.240.42 is sending
[  5] local 192.168.240.36 port 49539 connected to 192.168.240.42 port 5201
[ ID] Interval           Transfer     Bitrate
[  5]   0.00-1.00   sec   109 MBytes   910 Mbits/sec
[  5]   1.00-2.00   sec   112 MBytes   937 Mbits/sec
[  5]   2.00-3.00   sec   112 MBytes   937 Mbits/sec
[  5]   3.00-4.00   sec   112 MBytes   937 Mbits/sec
[  5]   4.00-5.00   sec   112 MBytes   937 Mbits/sec
[  5]   5.00-6.00   sec   112 MBytes   937 Mbits/sec
[  5]   6.00-7.00   sec   111 MBytes   934 Mbits/sec
[  5]   7.00-8.00   sec   112 MBytes   937 Mbits/sec
[  5]   8.00-9.00   sec   112 MBytes   937 Mbits/sec
[  5]   9.00-10.00  sec   112 MBytes   937 Mbits/sec
- - - - - - - - - - - - - - - - - - - - - - - - -
[ ID] Interval           Transfer     Bitrate         Retr
[  5]   0.00-10.00  sec  1.09 GBytes   935 Mbits/sec    0             sender
[  5]   0.00-10.00  sec  1.09 GBytes   935 Mbits/sec                  receiver

iperf Done.
Probably network related tasks need to be redistributed among espressobin cpu´s.
I would like to test again with mainline kernel once available.
-
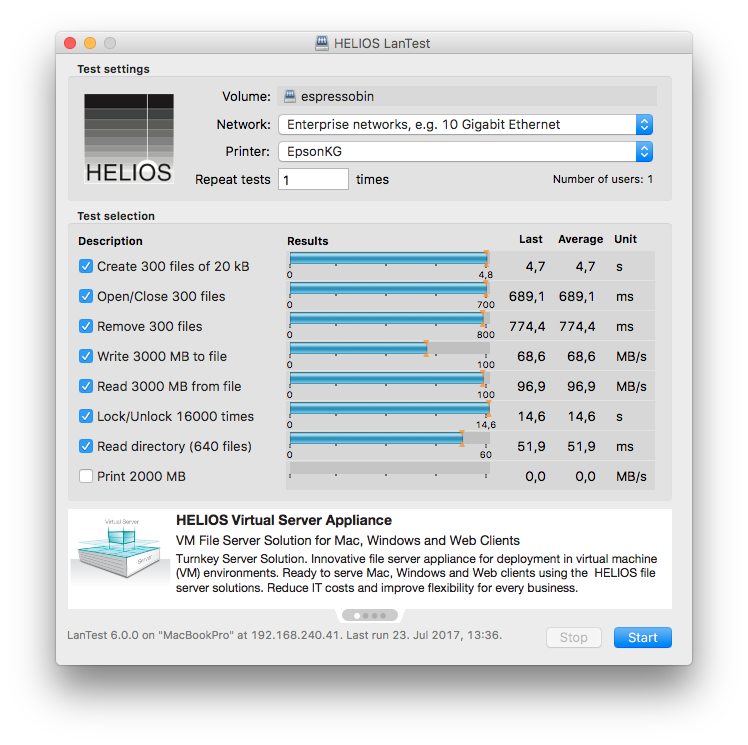
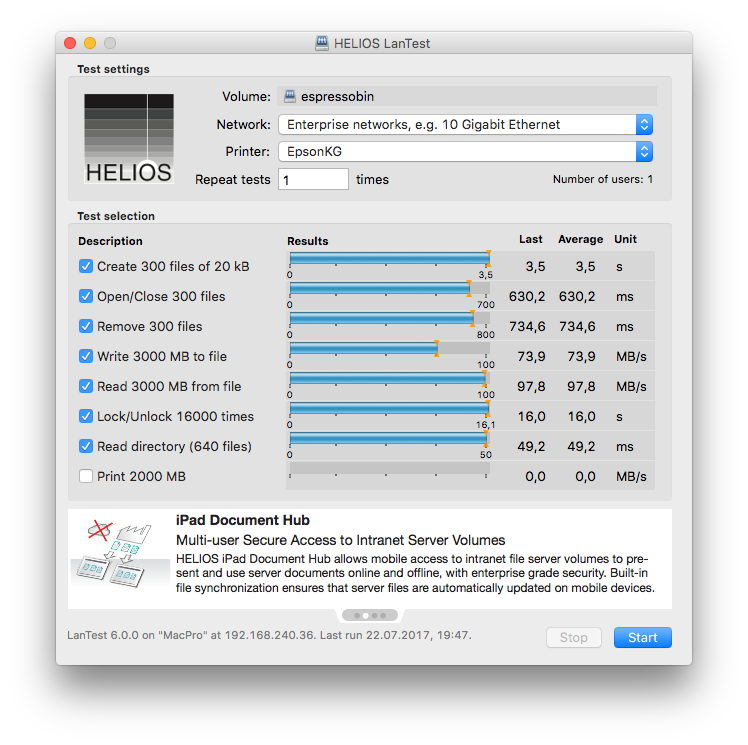
I have installed Netatalk 3.1.11 and tried the Helios Lan Test. The storage used by netatalk is an SSD (OCZ Vertex 128G) attached to the SATA port of espressobin (see the test results below).
Additionally, I manually uploaded a 2260MB file via the macOS finder (afpd) to espressobin in 52s (43MB/s) and downloaded it again to a MacPro in 20s (113 MB/s).
I guess that the write speed is limited by the SSD - read speed of netatalk/espressobin is pretty impressive ...
I have used the latest Armbian image (Armbian_5.32.170626_Espressobin_Ubuntu_xenial_default_4.4.73.7z) - If you have a more recent image to test, please let me know.
-
Power consumption of espressobin during the boot process is between 4.5 - 5.0 W.
I am running Armbian on SD - idle power consumption is 3.0 W (ondemand governor).
Consumption rises to 3.6 W while compiling source code using both kernels ...
(Armbian already runs perfectly stable)
root@espressobin:# cat /proc/version Linux version 4.4.73-mvebu64 (root@devel) (gcc version 5.4.0 20160609 (Ubuntu/Linaro 5.4.0-6ubuntu1~16.04.4) ) #9 SMP PREEMPT Sun Jun 25 22:02:55 CEST 2017 root@espressobin:# cpufreq-info cpufrequtils 008: cpufreq-info (C) Dominik Brodowski 2004-2009 Report errors and bugs to cpufreq@vger.kernel.org, please. analyzing CPU 0: driver: cpufreq-dt CPUs which run at the same hardware frequency: 0 1 CPUs which need to have their frequency coordinated by software: 0 1 maximum transition latency: 50.0 us. hardware limits: 200 MHz - 1000 MHz available frequency steps: 200 MHz, 250 MHz, 500 MHz, 1000 MHz available cpufreq governors: conservative, userspace, powersave, ondemand, performance current policy: frequency should be within 200 MHz and 800 MHz. The governor "ondemand" may decide which speed to use within this range. current CPU frequency is 250 MHz. cpufreq stats: 200 MHz:83.97%, 250 MHz:8.44%, 500 MHz:7.09%, 1000 MHz:0.51% (998) analyzing CPU 1: driver: cpufreq-dt CPUs which run at the same hardware frequency: 0 1 CPUs which need to have their frequency coordinated by software: 0 1 maximum transition latency: 50.0 us. hardware limits: 200 MHz - 1000 MHz available frequency steps: 200 MHz, 250 MHz, 500 MHz, 1000 MHz available cpufreq governors: conservative, userspace, powersave, ondemand, performance current policy: frequency should be within 200 MHz and 800 MHz. The governor "ondemand" may decide which speed to use within this range. current CPU frequency is 250 MHz. cpufreq stats: 200 MHz:83.97%, 250 MHz:8.44%, 500 MHz:7.09%, 1000 MHz:0.51% (998) -
To flash ct-lubuntu-server-nand-v2.0.img did not solve the problem in my case:
The system did boot lubuntu from nand afterwards. I then booted from SD and started the nand-sata-install script.
After a roboot i ended up with no video output or LED activity just as described by pille above.
A workaround in my case was to comment out "formatnand" in line 462 of the nand-sata-install script, re-run the script and after a reboot (without SD) the system did boot from nand as expected! (This would imply that there is still an error in the function formatnand )
-
Today I tried to install Armbian Jessie Server 5.25 from SD to nand on a Cubietruck (Legacy 3.4.113 kernel).
The system does not boot from nand, since /dev/nand1 can not be mounted.
This seems to be caused by an error in line 288 of /usr/lib/nand-sata-install/nand-sata-install.sh :
mkfs.vfat -qF /dev/nand1 >> $logfile 2>&1
The option "-qF" is meaningful after mkfs.ext4 but should be deleted after mkfs.vfat .
Cheers,
Wolfgang
-
I realised today that I have the same issue - here is how to solve it
(I am running Jessie with Kernel 4.7.3 and sysv-init - not systemd)
The problem is that /etc/init.d/armhwinfo starts before /etc/init.d/ramlog.
You can change that in the following way:
1.) add ramlog to Required-Start and Required-Stop in /etc/init.d/armhwinfo:
#!/bin/bash
### BEGIN INIT INFO
# Provides: armhwinfo
# Required-Start: ramlog
# Required-Stop: glibc ramlog
# Default-Start: 2 3 4 5
# Default-Stop: 0 1 6
# Short-Description: Armbian gathering hardware information
### END INIT INFO
2.) enter the following commands as root:dpkg-reconfigure insservupdate-rc.d armhwinfo defaultsshutdown -r now # reboot at least two timesCheers,lupus
More proper testing - better Armbian experience
in Advanced users - Development
Posted
Edit: this seems to related to a hardware issue on cubietruck. Currently there is no access to nand anymore from sd ...
This may not be a top priority issue, but I observe problems with Armbian 5.33 on nand using jessie, stretch and xenial (legacy kernel). It seems to be related to armbian-config observed on a cubietruck.
User built systems with legacy kernel 113 were flashed onto an sd card. Booting from SD works well and formatting, transferring the system to nand using armbian-config and booting into nand works too.
After the first boot df displays the availability of 7GB of nand2 storage and 32MB of nand1 storage. The filesystem is writable.
It is indicated on the welcome screen that a reboot is necessary to complete resizing of the file system !
The first reboot hangs for minutes and a cold start needs to be performed.
After that the file system is mounted in read only mode - not writable anymore.
Edit: There seems to be a hardware problem with nand. CPU temp is 53 degrees after booting from nand - but only 42 degrees after booting from sd...