

djurny
-
Posts
66 -
Joined
-
Last visited
Content Type
Forums
Store
Crowdfunding
Applications
Events
Raffles
Community Map
Posts posted by djurny
-
-
3 hours ago, SR-G said:
I would be fine with this solution on my side if it was working
") (but on my side it's not enough to have same freq. for min and max value (also with 1.8 Ghz, i haven't tryed with lower values) + "performance" or "governor" mode.
(but on my side it's not enough to have same freq. for min and max value (also with 1.8 Ghz, i haven't tryed with lower values) + "performance" or "governor" mode.
Hi @SR-G,
FYI I have been running Linux kobol0 5.9.13-rockchip64 #trunk.16 SMP PREEMPT Tue Dec 8 21:23:17 CET 2020 aarch64 GNU/Linux for some days now. Still up. Perhaps you can give this one a try?
Distributor ID: Debian
Description:    Debian GNU/Linux 10 (buster)
Release:        10
Codename:       buster
/etc/default/cpufrequtils:
ENABLE=true
MIN_SPEED=408000
MAX_SPEED=1200000
GOVERNOR=powersave
(The box runs idles with 'powersave' and will be set to 'performance' when performing tasks.)
I do not know which non-dev kernel version this is? I assume it's 21.02 or 21.03?
Groetjes, -
3 hours ago, Glock24 said:
Hello, what's the disk space needed to seed the torrents?
On a side note, would creating a repository mirror also help?
Hi,
I would also be interested in finding out what it would take to host a local repository mirror. Over the past few weeks I did try to rsync the repo to local storage, but I'm not sure if that will affect anything on the 'other' side. Had to break off the rsync as it appeared to sync extremely slow.
Groetjes,
-
Hi @tikey,
Did you make sure the SSD is making proper contact to the backplane connector? I also have some issues with the utmost left disk slot, when I remove/replace a disk in that slot, I have to open up the box and make sure that the connectors are tight and snug. If that does not help, you can try to insert the disk in another slot to rule out any connector or power rail issues. When box is open, make sure to also press down on the connectors in the main board, to make sure this is not related to loose cables or such.
Just FYI, I run a CT120BX500SSD1 in my box, although not the same model, but it works :-)
Groetjes,
-
Hi @3735943886,
When logging in on any of "my" Armbian devices, it will also (start and) attach to GNU screen session. I sometimes observe this behavior as well (mostly in aptitude and not armbian-config), but have not been able to pinpoint when this starts or what causes this.
Have you tried to detach from GNU screen and retry? If it shows and behaves correctly outside of GNU screen, you can start digging in the environment settings first by 'env'. Perhaps also show the current active LOCALEs and write down the terminal encoding configured for your ssh client/terminal, as for me sometimes the arrow keys refuse service in aptitude (seems linked to either wrong terminal enconding on connecting client or wrong terminal type set on the Armbian side).
I'll try to reproduce at home and share results, perhaps you can do the same, so we can compare output.
Groetjes,
-
Hi @snakekick,
USB HDD for snapraid parity, sounds like my setup! You can check with vm_block_dump what is waking up your device:
echo 1 | sudo tee /proc/sys/vm/block_dumpAbove will enable logging of block device accesses into syslog.
If you want to see it happen without flooding your /var/log/syslog:
sudo service rsyslog stop
while true ; do dmesg -cT ; done
sudo service rsyslog start
See: Documentation for /proc/sys/vm/* and How to conserve battery power using laptop-mode.
You should also check if you have enabled SMART offline auto testing on your HDD; that might also wake up your drive, but this is done by the drive itself:
sudo smartctl -a /dev/sdX | egrep 'offline'
sudo smartctl --offlineauto=off /dev/sdX
Other things that will wake up your drive: temperature monitoring services like hddtemp, you should check if it offers options to not access the drive if it's in standby/sleep mode. Other things like blkid when used as root, will also check all blockdevices, even if you think it is using cache.
What is the brand of USB dock you are using? Perhaps your dock is doing something to the drive to wake it up regularly.
Hope that helps,
Groetjes,
-
1 hour ago, Z06Frank said:
Here is the serial output......
[..]
libfdt fdt_check_header(): FDT_ERR_BADMAGIC
No FDT memory address configured. Please configure
the FDT address via "fdt addr <address>" command.
Aborting!
276 bytes read in 19 ms (13.7 KiB/s)
Applying user provided DT overlay dwc3-0-device.dtbo
No FDT memory address configured. Please configure
the FDT address via "fdt addr <address>" command.
Aborting!
Error applying DT overlays, restoring original DT
## Loading init Ramdisk from Legacy Image at 06000000 ...
   Image Name:   uInitrd
   Image Type:   AArch64 Linux RAMDisk Image (gzip compressed)
   Data Size:    17971336 Bytes = 17.1 MiB
   Load Address: 00000000
   Entry Point:  00000000
   Verifying Checksum ... OK
ERROR: Did not find a cmdline Flattened Device Tree
   Loading Ramdisk to f4dc3000, end f5ee6888 ... OK
FDT and ATAGS support not compiled in - hanging
### ERROR ### Please RESET the board ###
Hi,
Not sure if I can help here, but willing to help.
Can you put the SDcard into another Linux system and list the contents of the /boot folder? Also, please share the contents of the /boot/armbianEnv.txt. Looks like the same thing I had once, after a downgrade of kernel, the DTB files were renamed or not present for unknown reasons.
Groetjes
-
3 hours ago, Z06Frank said:
Note: I tried the basic reset button; the HHD's spin (and blue LED's flicker) for about 25 sec and it freezes with all blue LED's solid.
Hi,
Can you connect the USB-C cable, connect to the serial console (1.500.000 baud and no HW/SW flow control) and post the output after a reboot/powercycle? What's on the serial console should point to what is going wrong.
Did you by any change update the system and continue without rebooting? I had something similar happen on one of the nanopi R2S boxes, where the update was not successful, resulting in an incomplete /boot folder.
Groetjes,
-
Hi,
Short update. After looking at the most recent kernel freezes I experienced on 5.9.13-rockchip64 #trunk.16 and reading through a thread meant for Helios4, I decided to stop using cpufreq governor conservative. Switched to either 'powersave' or 'performance' depending on workload, but not to have the frequency changed on-the-fly. Box has been running smooth since last power cycle.
As system is nice and stable now, will do some more maintenance before upgrading to latest advised configuration.
Groetjes,
See last Oops, mentioning something about trying to set some regulator voltage, triggered by cpufreq-dt module: (Note that system did not fully freeze, parts of the sytem continued service).
Spoiler[73401.454765] Unable to handle kernel paging request at virtual address ffff80001757f838 [73401.455477] Mem abort info: [73401.455729] ESR = 0x96000007 [73401.456005] EC = 0x25: DABT (current EL), IL = 32 bits [73401.456476] SET = 0, FnV = 0 [73401.456750] EA = 0, S1PTW = 0 [73401.457031] Data abort info: [73401.457289] ISV = 0, ISS = 0x00000007 [73401.457630] CM = 0, WnR = 0 [73401.457898] swapper pgtable: 4k pages, 48-bit VAs, pgdp=000000000361b000 [73401.458490] [ffff80001757f838] pgd=00000000f7fff003, p4d=00000000f7fff003, pud=00000000f7ffe003, pmd=00000000d5751003, pte=0000000000000000 [73401.459600] Internal error: Oops: 96000007 [#1] PREEMPT SMP [73401.460095] Modules linked in: xfs dm_crypt algif_skcipher af_alg dm_mod governor_performance rfkill panfrost leds_pwm gpu_sched drm pwm_fan drm_panel_orientation_quirks gpio_charger fusb302 tcpm typec rockchip_vdec(C) hantro_vpu(C) rockchip_rga v4l2_h264 videobuf2_dma_contig v4l2_mem2mem videobuf2_vmalloc videobuf2_dma_sg videobuf2_memops videobuf2_v4l2 videobuf2_common videodev mc sg gpio_beeper cpufreq_dt nfsd auth_rpcgss nfs_acl lockd grace lm75 sunrpc ip_tables x_tables autofs4 raid10 raid456 async_raid6_recov async_memcpy async_pq async_xor async_tx raid1 raid0 multipath linear md_mod uas realtek dwmac_rk stmmac_platform stmmac mdio_xpcs adc_keys [73401.465226] CPU: 5 PID: 25414 Comm: kworker/5:1 Tainted: G C 5.9.13-rockchip64 #trunk.16 [73401.466053] Hardware name: Helios64 (DT) [73401.466421] Workqueue: events dbs_work_handler [73401.466821] pstate: 80000085 (Nzcv daIf -PAN -UAO BTYPE=--) [73401.467322] pc : save_stack_trace+0x3c/0x70 [73401.467698] lr : unwind_frame+0xc8/0x1a0 [73401.468047] sp : ffff80001557b3a0 [73401.468345] x29: ffff80001557b3a0 x28: ffff0000f5023880 [73401.468818] x27: 00000000000000fa x26: 0000000001000001 [73401.469290] x25: ffff80001557b4f0 x24: ffff800011849988 [73401.469762] x23: ffff800011526780 x22: ffff0000dc0f4880 [73401.470234] x21: ffff800010022178 x20: ffff80001557b3f0 [73401.470705] x19: ffff80001557b400 x18: 0000000000000000 [73401.471177] x17: 0000000000000000 x16: 0000000000000000 [73401.471648] x15: 0000000000000001 x14: 000000000000001b [73401.472120] x13: 000000000000039e x12: 0000000000000002 [73401.472592] x11: 0000000000000001 x10: 0000000000000a30 [73401.473064] x9 : ffff80001557b440 x8 : ffff0000dc0f5310 [73401.473535] x7 : ffff80001557b410 x6 : 0000000000000001 [73401.474007] x5 : 0000000000000000 x4 : 0000000000000001 [73401.474479] x3 : ffff80001757f838 x2 : ffff80001557b3d0 [73401.474950] x1 : ffff80001557b400 x0 : 0000000000000000 [73401.475423] Call trace: [73401.475650] save_stack_trace+0x3c/0x70 [73401.475996] return_address+0x5c/0x90 [73401.476329] preempt_count_add+0xb8/0x158 [73401.476690] _raw_spin_lock_irqsave+0x28/0x2f8 [73401.477090] lock_timer_base+0x68/0xd0 [73401.477426] try_to_del_timer_sync+0x34/0x98 [73401.477809] del_timer_sync+0x38/0x60 [73401.478136] schedule_timeout+0x1a0/0x370 [73401.478500] rk3x_i2c_xfer_common.isra.6+0x3dc/0x488 [73401.478942] rk3x_i2c_xfer+0x18/0x50 [73401.479263] __i2c_transfer+0x14c/0x670 [73401.479606] i2c_transfer+0x60/0x128 [73401.479927] i2c_transfer_buffer_flags+0x5c/0x88 [73401.480341] regmap_i2c_write+0x20/0x58 [73401.480685] _regmap_raw_write_impl+0x6fc/0x868 [73401.481088] _regmap_bus_raw_write+0x68/0x88 [73401.481468] _regmap_write+0x6c/0x160 [73401.481796] _regmap_update_bits+0xf8/0x110 [73401.482170] regmap_update_bits_base+0x64/0x98 [73401.482569] regulator_set_voltage_sel_regmap+0x48/0x98 [73401.483034] _regulator_call_set_voltage_sel+0x80/0xd0 [73401.483491] _regulator_do_set_voltage+0x460/0x5e0 [73401.483919] regulator_set_voltage_rdev+0xac/0x228 [73401.484346] regulator_do_balance_voltage+0x29c/0x400 [73401.484796] regulator_balance_voltage+0x50/0x90 [73401.485209] regulator_set_voltage_unlocked+0x94/0x128 [73401.485666] regulator_set_voltage+0x54/0x98 [73401.486051] _set_opp_voltage+0x44/0x148 [73401.486403] dev_pm_opp_set_rate+0x274/0x638 [73401.486792] set_target+0x40/0x88 [cpufreq_dt] [73401.487190] __cpufreq_driver_target+0x2b0/0x698 [73401.487603] cs_dbs_update+0xd8/0x160 [73401.487932] dbs_work_handler+0x40/0x78 [73401.488279] process_one_work+0x1ec/0x4b0 [73401.488636] worker_thread+0x48/0x478 [73401.488966] kthread+0x140/0x150 [73401.489258] ret_from_fork+0x10/0x34 [73401.489583] Code: 521b0860 d53cd044 d53cd043 f9800071 (c85f7c65) [73401.490125] ---[ end trace f822551f2480a969 ]--- [73401.490538] note: kworker/5:1[25414] exited with preempt_count 1After posting this, I configured cpufreq to use schedutil governor and after roughly 3 hours of load, it froze up with one of the other patterns observed before:
Spoiler[362047.870810] Unable to handle kernel NULL pointer dereference at virtual address 00000000000005dd [362047.871608] Mem abort info: [362047.871864] ESR = 0x96000004 [362047.872146] EC = 0x25: DABT (current EL), IL = 32 bits [362047.872622] SET = 0, FnV = 0 [362047.872901] EA = 0, S1PTW = 0 [362047.873187] Data abort info: [362047.873452] ISV = 0, ISS = 0x00000004 [362047.873800] CM = 0, WnR = 0 [362047.874074] user pgtable: 4k pages, 48-bit VAs, pgdp=00000000e4faf000 [362047.874648] [00000000000005dd] pgd=0000000000000000, p4d=0000000000000000 [362047.875257] Internal error: Oops: 96000004 [#1] PREEMPT SMP [362047.875757] Modules linked in: xfs dm_crypt algif_skcipher af_alg dm_mod governor_performance rfkill leds_pwm pwm_fan gpio_charger panfrost gpu_sched drm drm_panel_orientation_quirks rockchip_rga hantro_vpu(C) rockchip_vdec(C) videobuf2_dma_sg v4l2_h264 videobuf2_dma_contig v4l2_mem2mem videobuf2_vmalloc videobuf2_memops videobuf2_v4l2 videobuf2_common fusb302 tcpm videodev typec mc sg gpio_beeper cpufreq_dt nfsd lm75 auth_rpcgss nfs_acl lockd grace sunrpc ip_tables x_tables autofs4 raid10 raid456 async_raid6_recov async_memcpy async_pq async_xor async_tx raid1 raid0 multipath linear md_mod uas realtek dwmac_rk stmmac_platform stmmac mdio_xpcs adc_keys [362047.880874] CPU: 5 PID: 0 Comm: swapper/5 Tainted: G C 5.9.13-rockchip64 #trunk.16 [362047.881667] Hardware name: Helios64 (DT) [362047.882032] pstate: 40000085 (nZcv daIf -PAN -UAO BTYPE=--) [362047.882554] pc : preempt_count_add+0x10/0x158 [362047.882957] lr : efi_header_end+0x78/0x3f4 [362047.883332] sp : ffff800011b13e80 [362047.883638] x29: ffff800011b13e80 x28: ffff0000f6eae580 [362047.884124] x27: 0000000000000001 x26: ffff800011532db0 [362047.884609] x25: 0000000000000005 x24: 0000000000000000 [362047.885093] x23: ffff800011bdbdf0 x22: 0000000000000001 [362047.885576] x21: 0000000000000010 x20: ffff8000112a0518 [362047.886060] x19: ffff800011534580 x18: 0000000000000000 [362047.886543] x17: 0000000000000000 x16: 0000000000000000 [362047.887027] x15: 0000000000000006 x14: 0000000000000000 [362047.887509] x13: 00000000000000ed x12: 0000000000000000 [362047.887992] x11: 0000000000000001 x10: 0000000000000a30 [362047.888475] x9 : ffff800011bdbe80 x8 : ffff0000f6eaf010 [362047.888959] x7 : 0000000000436055 x6 : 000007e72f9f3d9c [362047.889442] x5 : 00ffffffffffffff x4 : ffff8000e6293000 [362047.889925] x3 : 0000000000000001 x2 : ffff8000e6293000 [362047.890408] x1 : ffff800011a58000 x0 : 0000000000000100 [362047.890891] Call trace: [362047.891129] preempt_count_add+0x10/0x158 [362047.891500] efi_header_end+0x78/0x3f4 [362047.891850] irq_exit+0xb8/0xd8 [362047.892152] handle_IPI+0x110/0x3c8 [362047.892489] gic_handle_irq+0x168/0x170 [362047.892850] el1_irq+0xb8/0x180 [362047.893155] arch_cpu_idle+0x14/0x20 [362047.893498] do_idle+0x1fc/0x270 [362047.893809] cpu_startup_entry+0x24/0x60 [362047.894181] secondary_start_kernel+0x16c/0x180 [362047.894613] Code: d503233f f000cc61 a9be7bfd 910003fd (b945d821) [362047.895187] ---[ end trace e70654e451e90e24 ]--- [362047.895618] Kernel panic - not syncing: Attempted to kill the idle task! [362047.896234] SMP: stopping secondary CPUs [362047.896609] Kernel Offset: disabled [362047.896938] CPU features: 0x0240022,2000200c [362047.897333] Memory Limit: none [362047.897645] ---[ end Kernel panic - not syncing: Attempted to kill the idle task! ]---Will change back to powersave and give it some load again.
Not sure if there is a correlation here.
Groetjes,
-
Hi,
Also here kernel Oops after some load:
[82182.500900] Unable to handle kernel paging request at virtual address ffff800011b14000
[..]
[82182.505753] Internal error: Oops: 96000007 [#1] PREEMPT SMP
[..]
[82182.526948] Call trace:
[82182.527414] x1 : ffff800011532db0 x0 : 00000000ffffffea
[82182.527921]  gic_handle_irq+0x124/0x158
[82182.528384] Call trace:
[82182.528883]  el1_irq+0xb8/0x180
[82182.529350]  __handle_domain_irq+0xc4/0x108
[82182.529593]  arch_cpu_idle+0x14/0x20
[82182.530058] Code: f822683a a94153f3 a9425bf5 a94363f7 (a9446bf9)
[82182.530425]  do_idle+0x210/0x260
[82182.530640] ---[ end trace c165b2007f1cb8d2 ]---
[82182.530946]  cpu_startup_entry+0x28/0x60
[82182.531312] Kernel panic - not syncing: Attempted to kill the idle task!
[82182.531657]  rest_init+0xd8/0xe8
[82182.532193] SMP: stopping secondary CPUs
[82182.532503]  arch_call_rest_init+0x10/0x1c
[82182.534913]  start_kernel+0x80c/0x848
[82182.535258] ---[ end trace c165b2007f1cb8d3 ]---
[82182.535692] Kernel Offset: disabled
[82182.536009] CPU features: 0x0240022,2000200c
[82182.536388] Memory Limit: none
[82182.536675] ---[ end Kernel panic - not syncing: Attempted to kill the idle task! ]---
It appears that the system had been idling for some hours before the page fault occurred.
Is there anything I can collect or try to see if this will improve? This oops seems unrelated to system load.
Thanks,
Groetjes,
Spoiler[82182.500900] Unable to handle kernel paging request at virtual address ffff800011b14000 [82182.500913] Mem abort info: [82182.501902] ESR = 0x96000007 [82182.501910] EC = 0x25: DABT (current EL), IL = 32 bits [82182.502669] SET = 0, FnV = 0 [82182.502676] EA = 0, S1PTW = 0 [82182.503246] Data abort info: [82182.503253] ISV = 0, ISS = 0x00000007 [82182.503869] CM = 0, WnR = 0 [82182.503878] swapper pgtable: 4k pages, 48-bit VAs, pgdp=000000000361e000 [82182.504750] [ffff800011b14000] pgd=00000000f7fff003, p4d=00000000f7fff003, pud=00000000f7ffe003, pmd=00000000f7ffa003 [82182.505750] pc : gic_handle_irq+0x124/0x158 [82182.505753] Internal error: Oops: 96000007 [#1] PREEMPT SMP [82182.505760] Modules linked in: xfs dm_crypt algif_skcipher af_alg dm_mod governor_performance rfkill r8152 leds_pwm panfrost gpio_charger pwm_fan gpu_sched drm drm_panel_orientation_quirks rockchip_vdec(C) hantro_vpu(C) rockchip_rga v4l2_h264 videobuf2_dma_contig fusb302 videobuf2_vmalloc v4l2_mem2mem videobuf2_dma_sg tcpm videobuf2_memops typec videobuf2_v4l2 videobuf2_common videodev mc sg gpio_beeper cpufreq_dt nfsd auth_rpcgss nfs_acl lockd grace lm75 sunrpc ip_tables x_tables autofs4 raid10 raid456 async_raid6_recov async_memcpy async_pq async_xor async_tx raid1 raid0 multipath linear md_mod uas realtek dwmac_rk stmmac_platform stmmac mdio_xpcs adc_keys [82182.506153] lr : gic_handle_irq+0x124/0x158 [82182.506652] CPU: 5 PID: 0 Comm: swapper/5 Tainted: G C 5.9.11-rockchip64 #trunk.2 [82182.511858] sp : ffff800011aebfe0 [82182.512228] Hardware name: Helios64 (DT) [82182.512237] pstate: 60000085 (nZCv daIf -PAN -UAO BTYPE=--) [82182.513033] x29: ffff800011aebfe0 x28: ffff800011853a80 [82182.513341] pc : __handle_domain_irq+0xc4/0x108 [82182.513350] lr : __handle_domain_irq+0xa8/0x108 [82182.513716] x27: ffff800011853a80 x26: ffff800011aec000 [82182.514206] sp : ffff800011b13fc0 [82182.514214] x29: ffff800011b13f80 x28: ffff0000f6eae580 [82182.514706] x25: ffff800011ae8000 x24: ffff80001129e970 [82182.515105] x27: 0000000000000001 x26: ffff8000100170c4 [82182.515536] x23: 0000000040000005 x22: ffff8000100170c4 [82182.516002] x25: ffff800011bdbf30 x24: 0000ffffffffffff [82182.516326] x21: ffff800011843ea0 x20: 000000000000001e [82182.516792] x23: ffff800011bdbdf0 x22: ffff800010011b78 [82182.517291] x19: 000000000000001e x18: 0000000000000010 [82182.517757] x21: ffff800011bdbf20 x20: 0000000000000000 [82182.518256] x17: 0000000000000000 x16: 0000000000000000 [82182.518723] x19: ffff0000f6eae580 x18: 0000000000000001 [82182.519223] x15: ffff800011853f28 x14: 0720072007200720 [82182.519690] x17: 0000000000000000 x16: 0000000000000000 [82182.520188] x13: 0720072007200720 x12: 0720072007200720 [82182.520655] x15: ffff0000f6eaea28 x14: ffffffffffffffff [82182.521154] x11: 0720072007200720 x10: 0720072007200720 [82182.521620] x13: ffff000016e1dd12 x12: ffff000016e1dd08 [82182.522120] x9 : 0720072007200720 x8 : 0720072007200720 [82182.522586] x11: 0000000005f5e100 x10: abcc77118461cefd [82182.523085] x7 : 0720072007200720 x6 : ffff0000f6e10f00 [82182.523551] x9 : 0000000000000002 x8 : 0000000000000002 [82182.524050] x5 : 0000000000000001 x4 : ffff0000f77141d8 [82182.524516] x7 : 0000000000000064 x6 : 000001cb50ff49e6 [82182.525016] x3 : 0000000000000000 x2 : 0000000000000002 [82182.525483] x5 : 00ffffffffffffff x4 : 0026641396c6f927 [82182.525981] x1 : ff5f2a3a499be400 x0 : 0000000000000000 [82182.526448] x3 : ffff80001151f018 x2 : ffff8000e6293000 [82182.526948] Call trace: [82182.527414] x1 : ffff800011532db0 x0 : 00000000ffffffea [82182.527921] gic_handle_irq+0x124/0x158 [82182.528384] Call trace: [82182.528883] el1_irq+0xb8/0x180 [82182.529350] __handle_domain_irq+0xc4/0x108 [82182.529593] arch_cpu_idle+0x14/0x20 [82182.530058] Code: f822683a a94153f3 a9425bf5 a94363f7 (a9446bf9) [82182.530425] do_idle+0x210/0x260 [82182.530640] ---[ end trace c165b2007f1cb8d2 ]--- [82182.530946] cpu_startup_entry+0x28/0x60 [82182.531312] Kernel panic - not syncing: Attempted to kill the idle task! [82182.531657] rest_init+0xd8/0xe8 [82182.532193] SMP: stopping secondary CPUs [82182.532503] arch_call_rest_init+0x10/0x1c [82182.534913] start_kernel+0x80c/0x848 [82182.535258] ---[ end trace c165b2007f1cb8d3 ]--- [82182.535692] Kernel Offset: disabled [82182.536009] CPU features: 0x0240022,2000200c [82182.536388] Memory Limit: none [82182.536675] ---[ end Kernel panic - not syncing: Attempted to kill the idle task! ]---Spoiler00:17:32: 408/ 600MHz 2.25 29% 6% 0% 0% 21% 0% 41.7<C2><B0>C 0/5 00:17:38: 408/ 408MHz 2.15 23% 10% 0% 0% 10% 0% 41.7<C2><B0>C 0/5 00:17:43: 1200/1008MHz 2.22 26% 9% 1% 0% 14% 0% 42.2<C2><B0>C 0/5 [..] ## minutes pass 00:18:46: 408/ 408MHz 2.21 27% 6% 0% 1% 18% 0% 42.8<C2><B0>C 0/5 00:18:51: 408/ 600MHz 2.19 28% 7% 0% 0% 18% 0% 42.2<C2><B0>C 0/5 00:18:57: 1800/ 408MHz 2.33 29% 14% 0% 2% 11% 0% 44.4<C2><B0>C 0/5 00:19:04: 408/ 600MHz 2.31 35% 6% 0% 0% 27% 0% 42.8<C2><B0>C 0/5 00:19:12: 600/ 600MHz 2.49 39% 8% 0% 0% 29% 0% 42.8<C2><B0>C 0/5 00:19:18: 408/ 600MHz 2.37 25% 7% 0% 1% 15% 0% 42.2<C2><B0>C 0/5 00:19:23: 1800/ 600MHz 2.42 22% 10% 0% 0% 10% 0% 50.6<C2><B0>C 0/5 Time big.LITTLE load %cpu %sys %usr %nice %io %irq CPU C.St. 00:19:28: 408/ 408MHz 2.31 12% 9% 0% 1% 0% 0% 42.8<C2><B0>C 0/5 00:19:33: 600/ 408MHz 2.13 4% 2% 0% 1% 0% 0% 42.2<C2><B0>C 0/5 00:19:38: 408/ 408MHz 1.95 2% 1% 0% 0% 0% 0% 41.7<C2><B0>C 0/5 00:19:44: 408/ 408MHz 1.96 2% 1% 0% 0% 0% 0% 42.2<C2><B0>C 0/5 00:19:49: 408/ 408MHz 1.80 2% 1% 0% 0% 0% 0% 41.7<C2><B0>C 0/5 00:19:54: 408/ 408MHz 1.60 2% 1% 0% 0% 0% 0% 41.1<C2><B0>C 0/5 00:19:59: 408/1416MHz 1.71 6% 4% 0% 0% 0% 0% 41.7<C2><B0>C 0/5 00:20:04: 408/ 408MHz 1.57 5% 3% 0% 1% 0% 0% 41.7<C2><B0>C 0/5 00:20:09: 408/ 408MHz 1.45 2% 1% 0% 0% 0% 0% 41.1<C2><B0>C 0/5 00:20:15: 408/ 408MHz 1.33 2% 1% 0% 0% 0% 0% 41.1<C2><B0>C 0/5 00:20:20: 408/ 408MHz 1.30 3% 2% 0% 0% 0% 0% 41.1<C2><B0>C 0/5 00:20:25: 408/ 408MHz 1.20 2% 1% 0% 0% 0% 0% 41.1<C2><B0>C 0/5 00:20:30: 600/ 408MHz 1.18 2% 2% 0% 0% 0% 0% 40.6<C2><B0>C 0/5 00:20:35: 408/ 408MHz 1.09 8% 5% 0% 2% 0% 0% 41.1<C2><B0>C 0/5 00:20:41: 816/ 408MHz 1.00 4% 2% 0% 0% 0% 0% 41.1<C2><B0>C 0/5 Time big.LITTLE load %cpu %sys %usr %nice %io %irq CPU C.St. 00:20:46: 408/ 408MHz 0.92 2% 1% 0% 0% 0% 0% 41.1<C2><B0>C 0/5 00:20:51: 408/ 408MHz 0.85 2% 1% 0% 0% 0% 0% 40.6<C2><B0>C 0/5 00:20:56: 600/ 600MHz 0.78 3% 2% 0% 0% 0% 0% 41.1<C2><B0>C 0/5 00:21:01: 408/ 408MHz 0.72 2% 1% 0% 0% 0% 0% 41.1<C2><B0>C 0/5 00:21:07: 408/ 408MHz 0.66 8% 5% 0% 2% 0% 0% 41.1<C2><B0>C 0/5 00:21:12: 600/ 408MHz 0.61 3% 1% 0% 0% 0% 0% 41.1<C2><B0>C 0/5 [..] ## hours pass 06:48:06: 408/ 408MHz 0.25 2% 1% 0% 0% 0% 0% 41.1<C2><B0>C 0/5 06:48:11: 408/ 408MHz 0.23 3% 2% 0% 0% 0% 0% 41.7<C2><B0>C 0/5 06:48:17: 408/ 600MHz 0.21 3% 2% 1% 0% 0% 0% 41.1<C2><B0>C 0/5 06:48:22: 408/1008MHz 0.20 3% 2% 0% 0% 0% 0% 41.7<C2><B0>C 0/5 06:48:27: 408/ 600MHz 0.18 8% 5% 0% 1% 0% 0% 41.1<C2><B0>C 0/5 [82182.500900] Unable to handle kernel paging request at virtual address ffff800011b14000
-
Hi all,
Something to share for those who use the USB-C serial console from another Linux host. Install and use 'tio' to connect to the serial console instead of minicom. This supports both 1500k baud and also can be easily used inside GNU screen (minicom gets a meta key conflict per default; CTRL-A is default meta key for both GNU screen and minicom). Minicom resulted in regular errors posted in syslog by the ftdi_sio kernel module. Did not run any strace to find out what syscall is causing it, but in short, tio appears to not treat the tty as a modem: no errors are popping up in syslog. Hopefully the serial consoles will remain up now.
One caveat: I did not find a way to send a BREAK over serial using tio. This is something that is handy in case kernel freezes up, as sometimes you will still have opportunity to do a magic sysrq triggered reboot (BREAK + b = initiate a reboot of the kernel, also see magic sysrq & REISUB).
Groetjes,
SpoilerHi all,
Not sure if this is related to the Helios64. I have connected all my Pi, Helios4 and Helios64 serial consoles to one of the Raspberry Pi devices. This way I can collect serial console dumps whenever things hit the fan.
For the Helios64 (and also the Helios4) console, I do get into trouble after some time. The ftdi_sio module on the Pi complains as follows:
Dec  5 06:25:45 pi2-03 kernel: [112461.799525] ftdi_sio ttyUSB5: failed to get modem status: -71
Dec  5 06:25:46 pi2-03 kernel: [112462.800633] ftdi_sio ttyUSB5: failed to get modem status: -71
[..]
Dec  5 06:25:57 pi2-03 kernel: [112473.814656] ftdi_sio ttyUSB5: failed to get modem status: -71
Dec  5 06:25:58 pi2-03 kernel: [112474.816044] ftdi_sio ttyUSB5: failed to get modem status: -71
And does so repeatedly. Note that it's always erroring on the Helios64 serial console, never about the Helios4 ones.
After a while the module gives up and all FTDI consoles will become unresponsive. Only way out is to reboot the Pi.
See configuration at and of post. All serial consoles are connected either directly or through generic PL2303 USB-to-serial converters to two el-cheapo USB hubs.
Next things to try are:
- Check picocom, tio (prefer GNU screen, but that will only work nicely after changing serial console baudrate on Helios64 side - not preferred).
- Try to find more hacks related to USB on the Pi.
Anyone have any ideas on what to check next?
Thanks,
Groetjes,
See spoilter for the setup, all Pi devices are connected via generic unbranded PL2303 USB-to-serial dongles.
Spoiler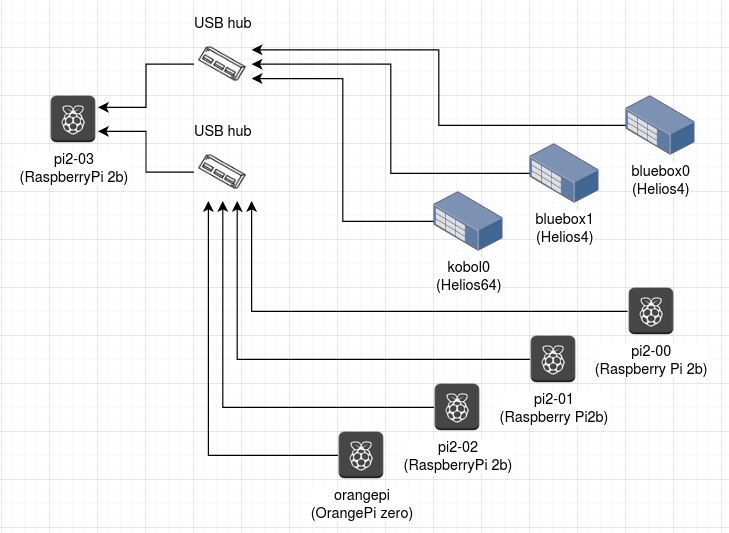
Kudos to Kobol for using proper FTDI device with a serial#, that way the Pi can identify what is connected to which tty (udev to the rescue).
SpoilerACTION=="remove", GOTO="my-usb-serial.end"
SUBSYSTEM!="tty", GOTO="my-usb-serial.end"ENV{ID_VENDOR_ID}=="067b", ENV{ID_MODEL_ID}=="2303", ENV{ID_PATH}=="platform-3f980000.usb-usb-0:1.2.1:1.0", SYMLINK+="serial/by-name/pi2-00" ## connected to USB hubs on pi2-03
ENV{ID_VENDOR_ID}=="067b", ENV{ID_MODEL_ID}=="2303", ENV{ID_PATH}=="platform-3f980000.usb-usb-0:1.2.2:1.0", SYMLINK+="serial/by-name/pi2-01" ## connected to USB hubs on pi2-03
ENV{ID_VENDOR_ID}=="067b", ENV{ID_MODEL_ID}=="2303", ENV{ID_PATH}=="platform-3f980000.usb-usb-0:1.2.3:1.0", SYMLINK+="serial/by-name/pi2-02" ## connected to USB hubs on pi2-03
ENV{ID_VENDOR_ID}=="067b", ENV{ID_MODEL_ID}=="2303", ENV{ID_PATH}=="platform-3f980000.usb-usb-0:1.2:1.0", SYMLINK+="serial/by-name/pi2-03" ## connected to pi2-00
ENV{ID_VENDOR_ID}=="067b", ENV{ID_MODEL_ID}=="2303", ENV{ID_PATH}=="platform-3f980000.usb-usb-0:1.2.4.1:1.0", SYMLINK+="serial/by-name/spare" ## connected to USB hubs on pi2-03
ENV{ID_VENDOR_ID}=="067b", ENV{ID_MODEL_ID}=="2303", ENV{ID_PATH}=="platform-3f980000.usb-usb-0:1.3.1:1.0", SYMLINK+="serial/by-name/orangepi" ## connected to USB hubs on pi2-03ENV{ID_VENDOR_ID}=="0403", ENV{ID_MODEL_ID}=="6015", ENV{ID_SERIAL_SHORT}=="DT03O6AD", SYMLINK+="serial/by-name/kobol0" ## connected to USB hubs on pi2-03
ENV{ID_VENDOR_ID}=="0403", ENV{ID_MODEL_ID}=="6015", ENV{ID_SERIAL_SHORT}=="DJ00JULE", SYMLINK+="serial/by-name/bluebox1" ## connected to USB hubs on pi2-03
ENV{ID_VENDOR_ID}=="0403", ENV{ID_MODEL_ID}=="6015", ENV{ID_SERIAL_SHORT}=="DJ00JDCX", SYMLINK+="serial/by-name/bluebox0" ## connected to USB hubs on pi2-03LABEL="my-usb-serial.end"
Note that all devices are connected to using GNU screen (115k2 baud), but Heliso64 has to use minicom as GNU screen does not like 1500k baud. Will try other terminal emulators as soon as I find some time.
-
Hi,
A short update, unfortunately kernel has crashed again, but after a couple of days. So there is improvement :-)
No serial console output, as the usb-serial connection on my Pi stopped responding (will open another thread on this, not really Helios64 related though).
Will restart some loading and try a different usb-serial setup, hopefully both will not crash (that often) anymore.
Groetjes,
-
Hi,
I've also experienced almost hourly instabilities when running some load on my Helios64 box. Tried several kernels, each with their own Oops/BUG pattern. See below for an overview:
Spoiler5.8.14-rockchip64 #20.08.10
[30241.791908] kernel BUG at arch/arm64/kernel/traps.c:470!
[30241.792383] Internal error: Oops - BUG: 0 [#1] PREEMPT SMP
[30241.792870] Modules linked in: xfs dm_crypt algif_skcipher af_alg dm_mod governor_performance rfkill r8152 hantro_vpu(C) rockchip_rga rockchip_vdec(C) panfrost videobuf2_vmalloc v4l2_h264 gpu_sched videobuf2_dma_contig videobuf2_dma_sg leds_pwm v4l2_mem2mem drm pwm_fan videobuf2_memops drm_panel_orientation_quirks gpio_charger videobuf2_v4l2 videobuf2_common videodev mc sg gpio_beeper cpufreq_dt nfsd auth_rpcgss nfs_acl lockd grace sunrpc lm75 ip_tables x_tables autofs4 raid10 raid456 async_raid6_recov async_memcpy async_pq async_xor async_tx raid1 raid0 multipath linear md_mod uas realtek dwmac_rk stmmac_platform stmmac mdio_xpcs adc_keys
[30241.797910] CPU: 5 PID: 0 Comm: swapper/5 Tainted: G         C        5.8.14-rockchip64 #20.08.10
[30241.798692] Hardware name: Helios64 (DT)
[30241.799046] pstate: 00000085 (nzcv daIf -PAN -UAO BTYPE=--)
[30241.799547] pc : do_undefinstr+0x2ec/0x310
[30241.799913] lr : do_undefinstr+0x1e0/0x310
[30241.800277] sp : ffff800011ad3d30
[30241.800574] x29: ffff800011ad3d30 x28: ffff0000f6ea6580
[30241.801048] x27: ffff0000f6ea6580 x26: ffff800011ad4000
[30241.801520] x25: ffff800011501d20 x24: 0000000000000000
[30241.801993] x23: 0000000060000085 x22: ffff800010df6118
[30241.802465] x21: ffff800011ad3ee0 x20: ffff0000f6ea6580
[30241.802937] x19: ffff800011ad3da0 x18: 00000000000000fb
[30241.803409] x17: 0000000000000000 x16: 0000000000000200
[30241.803882] x15: 0000000000000000 x14: 00000000000001bb
[30241.804355] x13: 0000000000000205 x12: 0000000000000268
[30241.804827] x11: 0000000000000001 x10: 0000000000000005
[30241.805298] x9 : ffff0000f77c9590 x8 : ffff0000f77c8bc0
[30241.805770] x7 : ffff0000180cac40 x6 : ffff800011ad3d88
[30241.806242] x5 : 00000000d5300000 x4 : ffff800011816118
[30241.806714] x3 : 00000000d5000000 x2 : 0000000000000002
[30241.807186] x1 : ffff0000f6ea6580 x0 : 0000000060000085
[30241.807658] Call trace:
[30241.807883]  do_undefinstr+0x2ec/0x310
[30241.808222]  el1_sync_handler+0x88/0x110
[30241.808574]  el1_sync+0x7c/0x100
[30241.808869]  rcu_dynticks_eqs_enter+0x30/0x70
[30241.809259]  rcu_nmi_exit+0x7c/0x250
[30241.809580]  rcu_irq_exit+0x10/0x20
[30241.809897]  irq_exit+0x4c/0xe0
[30241.810184]  handle_IPI+0x25c/0x3e8
[30241.810501]  gic_handle_irq+0x154/0x158
[30241.810844]  el1_irq+0xb8/0x180
[30241.811128]  arch_cpu_idle+0x28/0x218
[30241.811459]  default_idle_call+0x1c/0x44
[30241.811813]  do_idle+0x210/0x288
[30241.812104]  cpu_startup_entry+0x28/0x68
[30241.812457]  secondary_start_kernel+0x140/0x178
[30241.812865] Code: f9401bf7 17ffff7d a9025bf5 f9001bf7 (d4210000)
5.9.10-rockchip64 #20.11
[14692.347605] Unable to handle kernel paging request at virtual address ffdf8000119c4010
[14692.348319] Mem abort info:
[14692.348569]   ESR = 0x96000004
[14692.348843]   EC = 0x25: DABT (current EL), IL = 32 bits
[14692.349311]   SET = 0, FnV = 0
[14692.349582]   EA = 0, S1PTW = 0
[14692.349861] Data abort info:
[14692.350118]   ISV = 0, ISS = 0x00000004
[14692.350457]   CM = 0, WnR = 0
[14692.350722] [ffdf8000119c4010] address between user and kernel address ranges
[14692.351350] Internal error: Oops: 96000004 [#1] PREEMPT SMP
[14692.351843] Modules linked in: xfs dm_crypt algif_skcipher af_alg dm_mod governor_performance rfkill
[14692.356998] CPU: 4 PID: 0 Comm: swapper/4 Tainted: G         C        5.9.10-rockchip64 #20.11
[14692.357754] Hardware name: Helios64 (DT)
[14692.358105] pstate: 00000085 (nzcv daIf -PAN -UAO BTYPE=--)
[14692.358603] pc : ktime_get+0x3c/0xa0
[14692.358924] lr : tick_irq_enter+0x58/0x110
[14692.359287] sp : ffff800011b0bf00
[14692.359582] x29: ffff800011b0bf00 x28: ffff0000f6ead700
[14692.360053] x27: 0000000000000001 x26: 0000000000000000
[14692.360523] x25: ffff0000f6c04300 x24: ffff800011bd3df0
[14692.360992] x23: ffff800011532db0 x22: 00000000006aa93a
[14692.361461] x21: 00000d5cc0701cac x20: ffff800011a7c040
[14692.361930] x19: ffff0000f779af40 x18: 0000000000000000
[14692.362398] x17: 0000000000000000 x16: 0000000000000000
[14692.362867] x15: 000000000000001c x14: 000000000000001d
[14692.363336] x13: 00000000000000d6 x12: 00000000000000ea
[14692.363805] x11: 0000000000000001 x10: 0000000000000a30
[14692.364274] x9 : ffff800011bd3e70 x8 : ffff0000f6eae190
[14692.364743] x7 : 00000000ffffffff x6 : 000000522ff31dbf
[14692.365212] x5 : 00ffffffffffffff x4 : ffff0000f77a89a0
[14692.365680] x3 : ffff80001151f018 x2 : ffff800011849980
[14692.366149] x1 : ffff800011527f40 x0 : ffdf8000119c4010
[14692.366619] Call trace:
[14692.366840]  ktime_get+0x3c/0xa0
[14692.367129]  tick_irq_enter+0x58/0x110
[14692.367465]  irq_enter_rcu+0x44/0x60
[14692.367784]  irq_enter+0x14/0x20
[14692.368074]  __handle_domain_irq+0x70/0x108
[14692.368448]  gic_handle_irq+0x60/0x158
[14692.368783]  el1_irq+0xb8/0x180
[14692.369066]  arch_cpu_idle+0x14/0x20
[14692.369386]  do_idle+0x210/0x260
[14692.369674]  cpu_startup_entry+0x28/0x60
[14692.370024]  secondary_start_kernel+0x148/0x180
[14692.370430] Code: 37000316 d50339bf f9402680 f9403a95 (f9400001)
5.8.17-rockchip64 #20.08.21
15:42:37:  816/ 408MHz  1.65  12%   9%   1%   1%   0%   0% 43.9<C2><B0>C  0/5
15:42:42:  816/ 600MHz  1.60  12%   9%   1%   1%   0%   0% 43.9<C2><B0>C  0/5
15:42:47: 1200/ 600MHz  1.55  16%  11%   1%   2%   0%   0% 46.2<C2><B0>C  0/5
15:42:52:  408/ 408MHz  1.50  14%  11%   1%   1%   0%   0% 44.4<C2><B0>C  0/5
15:42:57: 1008/1200MHz  1.46  19%  13%   1%   2%   1%   0% 46.2<C2><B0>C  0/5[ 4561.947127] Unable to handle kernel paging request at virtual address ffdf800011989590
[ 4561.947840] Mem abort info:
[ 4561.948090]   ESR = 0x96000004
[ 4561.948364]   EC = 0x25: DABT (current EL), IL = 32 bits
[ 4561.948833]   SET = 0, FnV = 0
[ 4561.949105]   EA = 0, S1PTW = 0
[ 4561.949385] Data abort info:
[ 4561.949642]   ISV = 0, ISS = 0x00000004
[ 4561.949981]   CM = 0, WnR = 0
[ 4561.950248] [ffdf800011989590] address between user and kernel address ranges
[ 4561.950877] Internal error: Oops: 96000004 [#1] PREEMPT SMP
[ 4561.951370] Modules linked in: xfs dm_crypt algif_skcipher af_alg dm_mod governor_performance rfkill r8152 panfrost gpu_sched leds_pwm drm hantro_vpu(C) gpio_charger rockchip_vdec(C) pwm_fan drm_panel_orientation_quirks v4l2_h264 videobuf2_dma_contig rockchip_rga v4l2_mem2mem videobuf2_vmalloc videobuf2_dma_sg videobuf2_memops videobuf2_v4l2 videobuf2_common videodev mc sg gpio_beeper cpufreq_dt nfsd auth_rpcgss nfs_acl lockd lm75 grace sunrpc ip_tables x_tables autofs4 raid10 raid456 async_raid6_recov async_memcpy async_pq async_xor async_tx raid1 raid0 multipath linear md_mod uas realtek dwmac_rk stmmac_platform stmmac mdio_xpcs adc_keys
[ 4561.956377] CPU: 4 PID: 0 Comm: swapper/4 Tainted: G         C        5.8.17-rockchip64 #20.08.21
[ 4561.957155] Hardware name: Helios64 (DT)
[ 4561.957506] pstate: 00000085 (nzcv daIf -PAN -UAO BTYPE=--)
[ 4561.958010] pc : ktime_get+0x3c/0xa0
[ 4561.958331] lr : tick_sched_timer+0x38/0xb0
[ 4561.958703] sp : ffff800011adbdd0
[ 4561.959000] x29: ffff800011adbdd0 x28: ffff0000f779ba00
[ 4561.959473] x27: ffff0000f779bf08 x26: 0000000000000001
[ 4561.959946] x25: ffff8000114ee018 x24: 0000000000000080
[ 4561.960418] x23: ffff8000114ee018 x22: 00000000001e137e
[ 4561.960890] x21: 000004261f64e325 x20: ffff800011a40080
[ 4561.961361] x19: ffff0000f779bf08 x18: 0000000000000000
[ 4561.961833] x17: 0000000000000000 x16: 0000000000000000
[ 4561.962304] x15: 0000000000000000 x14: 0000000000000000
[ 4561.962776] x13: 000000000000033d x12: 000000000000038d
[ 4561.963247] x11: 0000000000000040 x10: ffff80001182e690
[ 4561.963719] x9 : ffff80001182e688 x8 : ffff0000f6800270
[ 4561.964191] x7 : 0000000000000000 x6 : 0000000000000000
[ 4561.964662] x5 : 0000000000000000 x4 : ffff0000f779bf08
[ 4561.965134] x3 : ffff8000114ee018 x2 : 0000000000010001
[ 4561.965605] x1 : ffff800011501d20 x0 : ffdf800011989590
[ 4561.966078] Call trace:
[ 4561.966303]  ktime_get+0x3c/0xa0
[ 4561.966594]  tick_sched_timer+0x38/0xb0
[ 4561.966939]  __hrtimer_run_queues+0x148/0x3b0
[ 4561.967329]  hrtimer_interrupt+0xf4/0x258
[ 4561.967691]  arch_timer_handler_phys+0x34/0x48
[ 4561.968091]  handle_percpu_devid_irq+0xa0/0x2b8
[ 4561.968496]  generic_handle_irq+0x30/0x48
[ 4561.968855]  __handle_domain_irq+0x94/0x108
[ 4561.969230]  gic_handle_irq+0x60/0x158
[ 4561.969568]  el1_irq+0xb8/0x180
[ 4561.969856]  arch_cpu_idle+0x28/0x218
[ 4561.970186]  default_idle_call+0x1c/0x44
[ 4561.970537]  do_idle+0x210/0x288
[ 4561.970825]  cpu_startup_entry+0x24/0x68
[ 4561.971177]  secondary_start_kernel+0x140/0x178
[ 4561.971583] Code: 37000316 d50339bf f9402680 f9403a95 (f9400001)
[ 4561.972129] ---[ end trace d6ab2e3c9eea65e5 ]---
5.9.11-rockchip64 #trunk.2
19:21:50: 1416/ 408MHz  1.78  32%  19%   1%   3%   7%   0% 46.9<C2><B0>C  0/5
19:21:55:  408/1008MHz  1.72  29%  17%   1%   3%   5%   0% 45.0<C2><B0>C  0/5
19:22:01:  408/ 600MHz  1.74  26%  16%   1%   2%   5%   0% 44.4<C2><B0>C  0/5
19:22:06:  600/1416MHz  1.68  26%  15%   1%   3%   5%   0% 44.4<C2><B0>C  0/5
19:22:11: 1008/ 408MHz  1.63  26%  15%   1%   2%   6%   0% 45.6<C2><B0>C  0/5
19:22:16: 1416/1200MHz  1.66  25%  15%   1%   2%   5%   0% 46.9<C2><B0>C  0/5[10141.409339] kernel BUG at arch/arm64/kernel/traps.c:470!
[10141.409827] Internal error: Oops - BUG: 0 [#1] PREEMPT SMP
[10141.410314] Modules linked in: xfs dm_crypt algif_skcipher af_alg dm_mod governor_performance rfkill r8152 gpio_charger leds_pwm pwm_fan panfrost gpu_sched drm drm_panel_orientation_quirks hantro_vpu(C) rockchi
[10141.415490] CPU: 5 PID: 8086 Comm: kworker/5:0 Tainted: G         C        5.9.11-rockchip64 #trunk.2
[10141.416300] Hardware name: Helios64 (DT)
[10141.416664] Workqueue: events dbs_work_handler
[10141.417064] pstate: 00000085 (nzcv daIf -PAN -UAO BTYPE=--)
[10141.417562] pc : do_undefinstr+0x2ec/0x310
[10141.417928] lr : do_undefinstr+0x1e0/0x310
[10141.418293] sp : ffff80001f90b300
[10141.418590] x29: ffff80001f90b300 x28: ffff0000f6f5ab80
[10141.419063] x27: 00000000000000fa x26: 000000003b9aca00
[10141.419536] x25: 0000000001000001 x24: 0000000000000000
[10141.420008] x23: 0000000000000085 x22: ffff8000100221bc
[10141.420480] x21: ffff80001f90b4b0 x20: ffff0000f6f5ab80
[10141.420951] x19: ffff80001f90b370 x18: ffff0000a72cca00
[10141.421422] x17: 0000000000000000 x16: 0000000000000200
[10141.421893] x15: 000000000000000c x14: 0000003da66903a6
[10141.422365] x13: 000000000000020c x12: 0000000000000215
[10141.422836] x11: 0000000000000001 x10: 0000000000000a30
[10141.423307] x9 : ffff80001f90b440 x8 : ffff0000f6f5b610
[10141.423778] x7 : 0000000000000001 x6 : ffff80001f90b358
[10141.424249] x5 : 00000000d5300000 x4 : ffff800011856258
[10141.424720] x3 : 00000000d5000000 x2 : 0000000000000002
[10141.425191] x1 : ffff0000f6f5ab80 x0 : 0000000000000085
[10141.425664] Call trace:
[10141.425887]  do_undefinstr+0x2ec/0x310
[10141.426224]  el1_sync_handler+0x88/0x110
[10141.426574]  el1_sync+0x7c/0x100
[10141.426865]  save_return_addr+0x4/0x38
[10141.427201]  return_address+0x58/0x90
[10141.427534]  preempt_count_add+0xb8/0x158
[10141.427896]  _raw_spin_lock_irqsave+0x28/0xa0
[10141.428286]  prepare_to_wait_event+0x24/0xe8
[10141.428671]  rk3x_i2c_xfer_common.isra.0+0x3b8/0x480
[10141.429114]  rk3x_i2c_xfer+0x18/0x50
[10141.429434]  __i2c_transfer+0x144/0x650
[10141.429778]  i2c_transfer+0x60/0x128
[10141.430098]  i2c_transfer_buffer_flags+0x5c/0x88
[10141.430513]  regmap_i2c_write+0x20/0x58
[10141.430856]  _regmap_raw_write_impl+0x6f8/0x8c0
[10141.431259]  _regmap_bus_raw_write+0x68/0x88
[10141.431640]  _regmap_write+0x6c/0x160
[10141.431968]  _regmap_update_bits+0xf8/0x110
[10141.432341]  regmap_update_bits_base+0x64/0x98
[10141.432740]  regulator_set_voltage_sel_regmap+0x4c/0x98
[10141.433204]  _regulator_call_set_voltage_sel+0x78/0xd0
[10141.433660]  _regulator_do_set_voltage+0x474/0x5f0
[10141.434087]  regulator_set_voltage_rdev+0xac/0x230
[10141.434513]  regulator_do_balance_voltage+0x280/0x420
[10141.434963]  regulator_balance_voltage+0x50/0x90
[10141.435374]  regulator_set_voltage_unlocked+0x94/0x118
[10141.435830]  regulator_set_voltage+0x50/0x90
[10141.436214]  _set_opp_voltage+0x44/0x110
[10141.436566]  dev_pm_opp_set_rate+0x250/0x618
[10141.436956]  set_target+0x40/0x88 [cpufreq_dt]
[10141.437353]  __cpufreq_driver_target+0x1ec/0x668
[10141.437765]  cs_dbs_update+0x158/0x178
[10141.438102]  dbs_work_handler+0x40/0x80
[10141.438447]  process_one_work+0x1c4/0x470
[10141.438804]  worker_thread+0x4c/0x420
[10141.439134]  kthread+0x118/0x150
[10141.439426]  ret_from_fork+0x10/0x34
[10141.439749] Code: f9401bf7 17ffff7d a9025bf5 f9001bf7 (d4210000)
[10141.440291] ---[ end trace 1ab64c120ad3020b ]---
[10141.440704] note: kworker/5:0[8086] exited with preempt_count 2
[10141.441551] ------------[ cut here ]------------
[10141.441981] WARNING: CPU: 5 PID: 0 at kernel/rcu/tree.c:630 rcu_eqs_enter.isra.0+0x150/0x168
[10141.442725] Modules linked in: xfs dm_crypt algif_skcipher af_alg dm_mod governor_performance rfkill r8152 gpio_charger leds_pwm pwm_fan panfrost gpu_sched drm drm_panel_orientation_quirks hantro_vpu(C) rockchi
[10141.447877] CPU: 5 PID: 0 Comm: swapper/5 Tainted: G      D  C        5.9.11-rockchip64 #trunk.2
[10141.448650] Hardware name: Helios64 (DT)
[10141.449003] pstate: 200003c5 (nzCv DAIF -PAN -UAO BTYPE=--)
[10141.449500] pc : rcu_eqs_enter.isra.0+0x150/0x168
[10141.449920] lr : rcu_eqs_enter.isra.0+0x1c/0x168
[10141.450330] sp : ffff800011bdbee0
[10141.450627] x29: ffff800011bdbee0 x28: 0000000000000000
[10141.451099] x27: ffff0000f6eae580 x26: 0000000000000000
[10141.451571] x25: 0000000000000000 x24: ffff80001129e970
[10141.452043] x23: ffff0000f6eae580 x22: ffff800011533838
[10141.452514] x21: ffff80001184a2a0 x20: ffff800011849980
[10141.452986] x19: ffff8000115358c0 x18: 000000000000000e
[10141.453457] x17: 0000000000000001 x16: 0000000000000019
[10141.453928] x15: 0000000000000004 x14: 000000000000004c
[10141.454399] x13: 00000000000001f7 x12: 000000000000022a
[10141.454870] x11: 0000000000000001 x10: 0000000000000a30
[10141.455342] x9 : ffff800011bdbe70 x8 : ffff0000f6eaf010
[10141.455814] x7 : 00000000ffffffff x6 : 00000038c1df3765
[10141.456285] x5 : 00ffffffffffffff x4 : 00000000004d49de
[10141.456756] x3 : ffff80001151f018 x2 : 4000000000000000
[10141.457227] x1 : 4000000000000002 x0 : ffff0000f77c88c0
[10141.457699] Call trace:
[10141.457923]  rcu_eqs_enter.isra.0+0x150/0x168
[10141.458315]  rcu_idle_enter+0x10/0x20
[10141.458644]  default_idle_call+0x2c/0x1b8
[10141.459004]  do_idle+0x210/0x260
[10141.459295]  cpu_startup_entry+0x24/0x60
[10141.459649]  secondary_start_kernel
It's not exhaustive; in the end I did the following and the box is now running some load (snapraid scrub on ~12TiB of data) without any issue:
-
Enabled daily built kernel, now running Linux kobol0 5.9.11-rockchip64 #trunk.2 SMP PREEMPT Sun Nov 29 00:29:16 CET 2020 aarch64 GNU/Linux.
Why: Every kernel had their own pattern, either do_undefinstr or XHCI hangup or page fault. Assumed latest greatest has most fixes. -
Enabled the i2c dtb overlays.
Why: Some of the kernels showed some IRQ related to i2c in the Oops/BUG. Thought I find something in the dtb related to i2c and just enable it to see if that might fix something. -
Moved rootfs from USB stick to SATA SSD in slot4.
Why: Some of the kernels had a repeated hanging XHCI controller, so I tried to remove some USB devices from the controller, to see if the amount of load on the controller itself might be a vector (, Victor). - Also removed tlp and set SATA link power management to max_performance (hat tip @gprovost).
It's a weak investigation, as I fiddled with multiple things at once, trying to get things going quickly (I do not have much spare time to spend on this as I would like to). Still, perhaps this will trigger someone or give some more angles to fiddle with for others.
Fingers crossed.
Looking good so far:
djurny@kobol0:~$ uname -a
Linux kobol0 5.9.11-rockchip64 #trunk.2 SMP PREEMPT Sun Nov 29 00:29:16 CET 2020 aarch64 GNU/Linux
djurny@kobol0:~$ uptime
 07:26:58 up 2 days, 10:40,  7 users,  load average: 1.73, 1.76, 1.74
djurny@kobol0:~$
(The box has been running rdfind, xfs_fsr, snapraid scrub & check for the last 2 days (in that order).)
Groetjes,
-
Enabled daily built kernel, now running Linux kobol0 5.9.11-rockchip64 #trunk.2 SMP PREEMPT Sun Nov 29 00:29:16 CET 2020 aarch64 GNU/Linux.
-
-
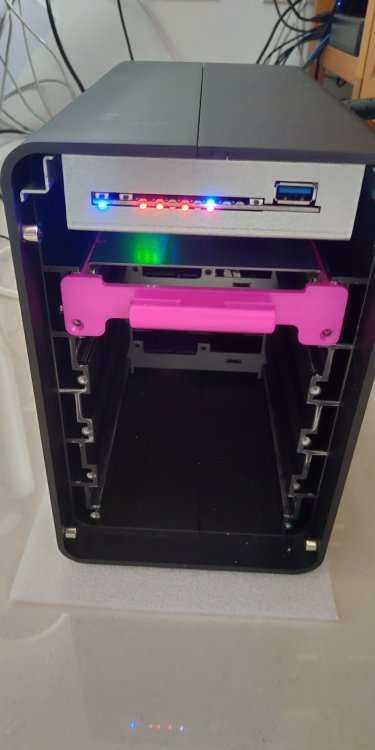
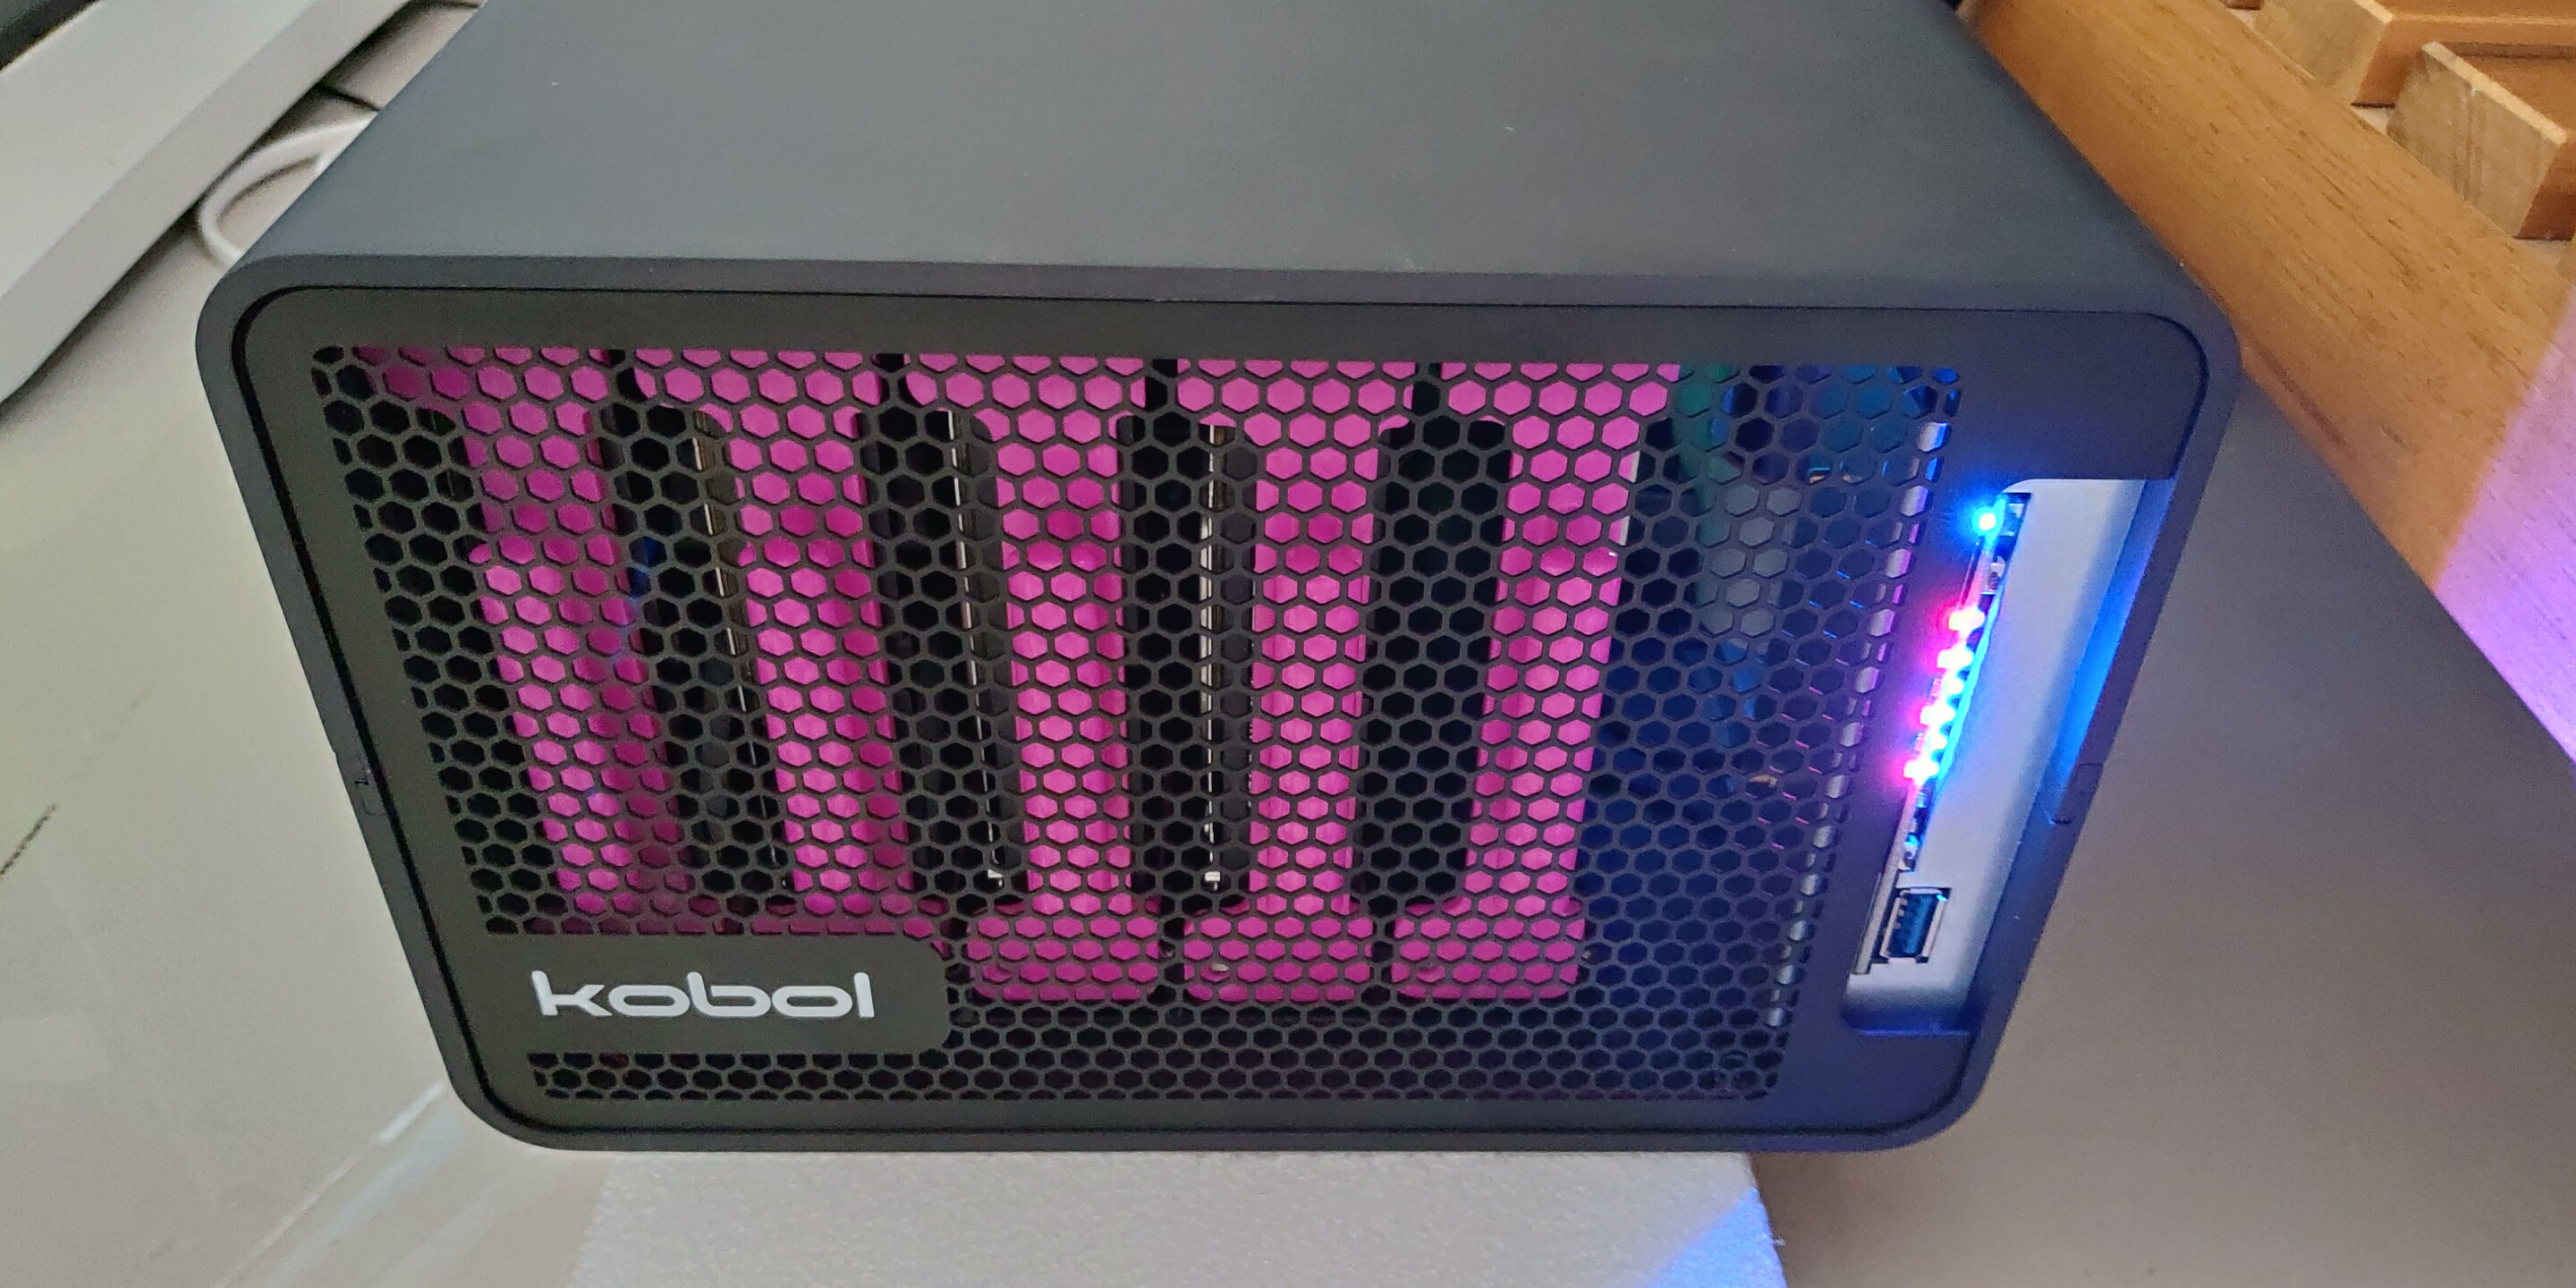
Hi,
It's only the "HDD x Activity LEDs" that are cycling. The other LEDs are not showing this cycling.
The cycling speed appears to increase with CPU frequency, just like how the "System Activity LED" (heartbeat trigger) frequency will increase when CPU frequency increases.
I made a video of the effect,
but have some trouble uploading it (>20MiB).here: https://streamable.com/v8wa36,Note I do not have any trouble with this effect, just wondering if this is by design and how I can customize it :-)
Groetjes,
-
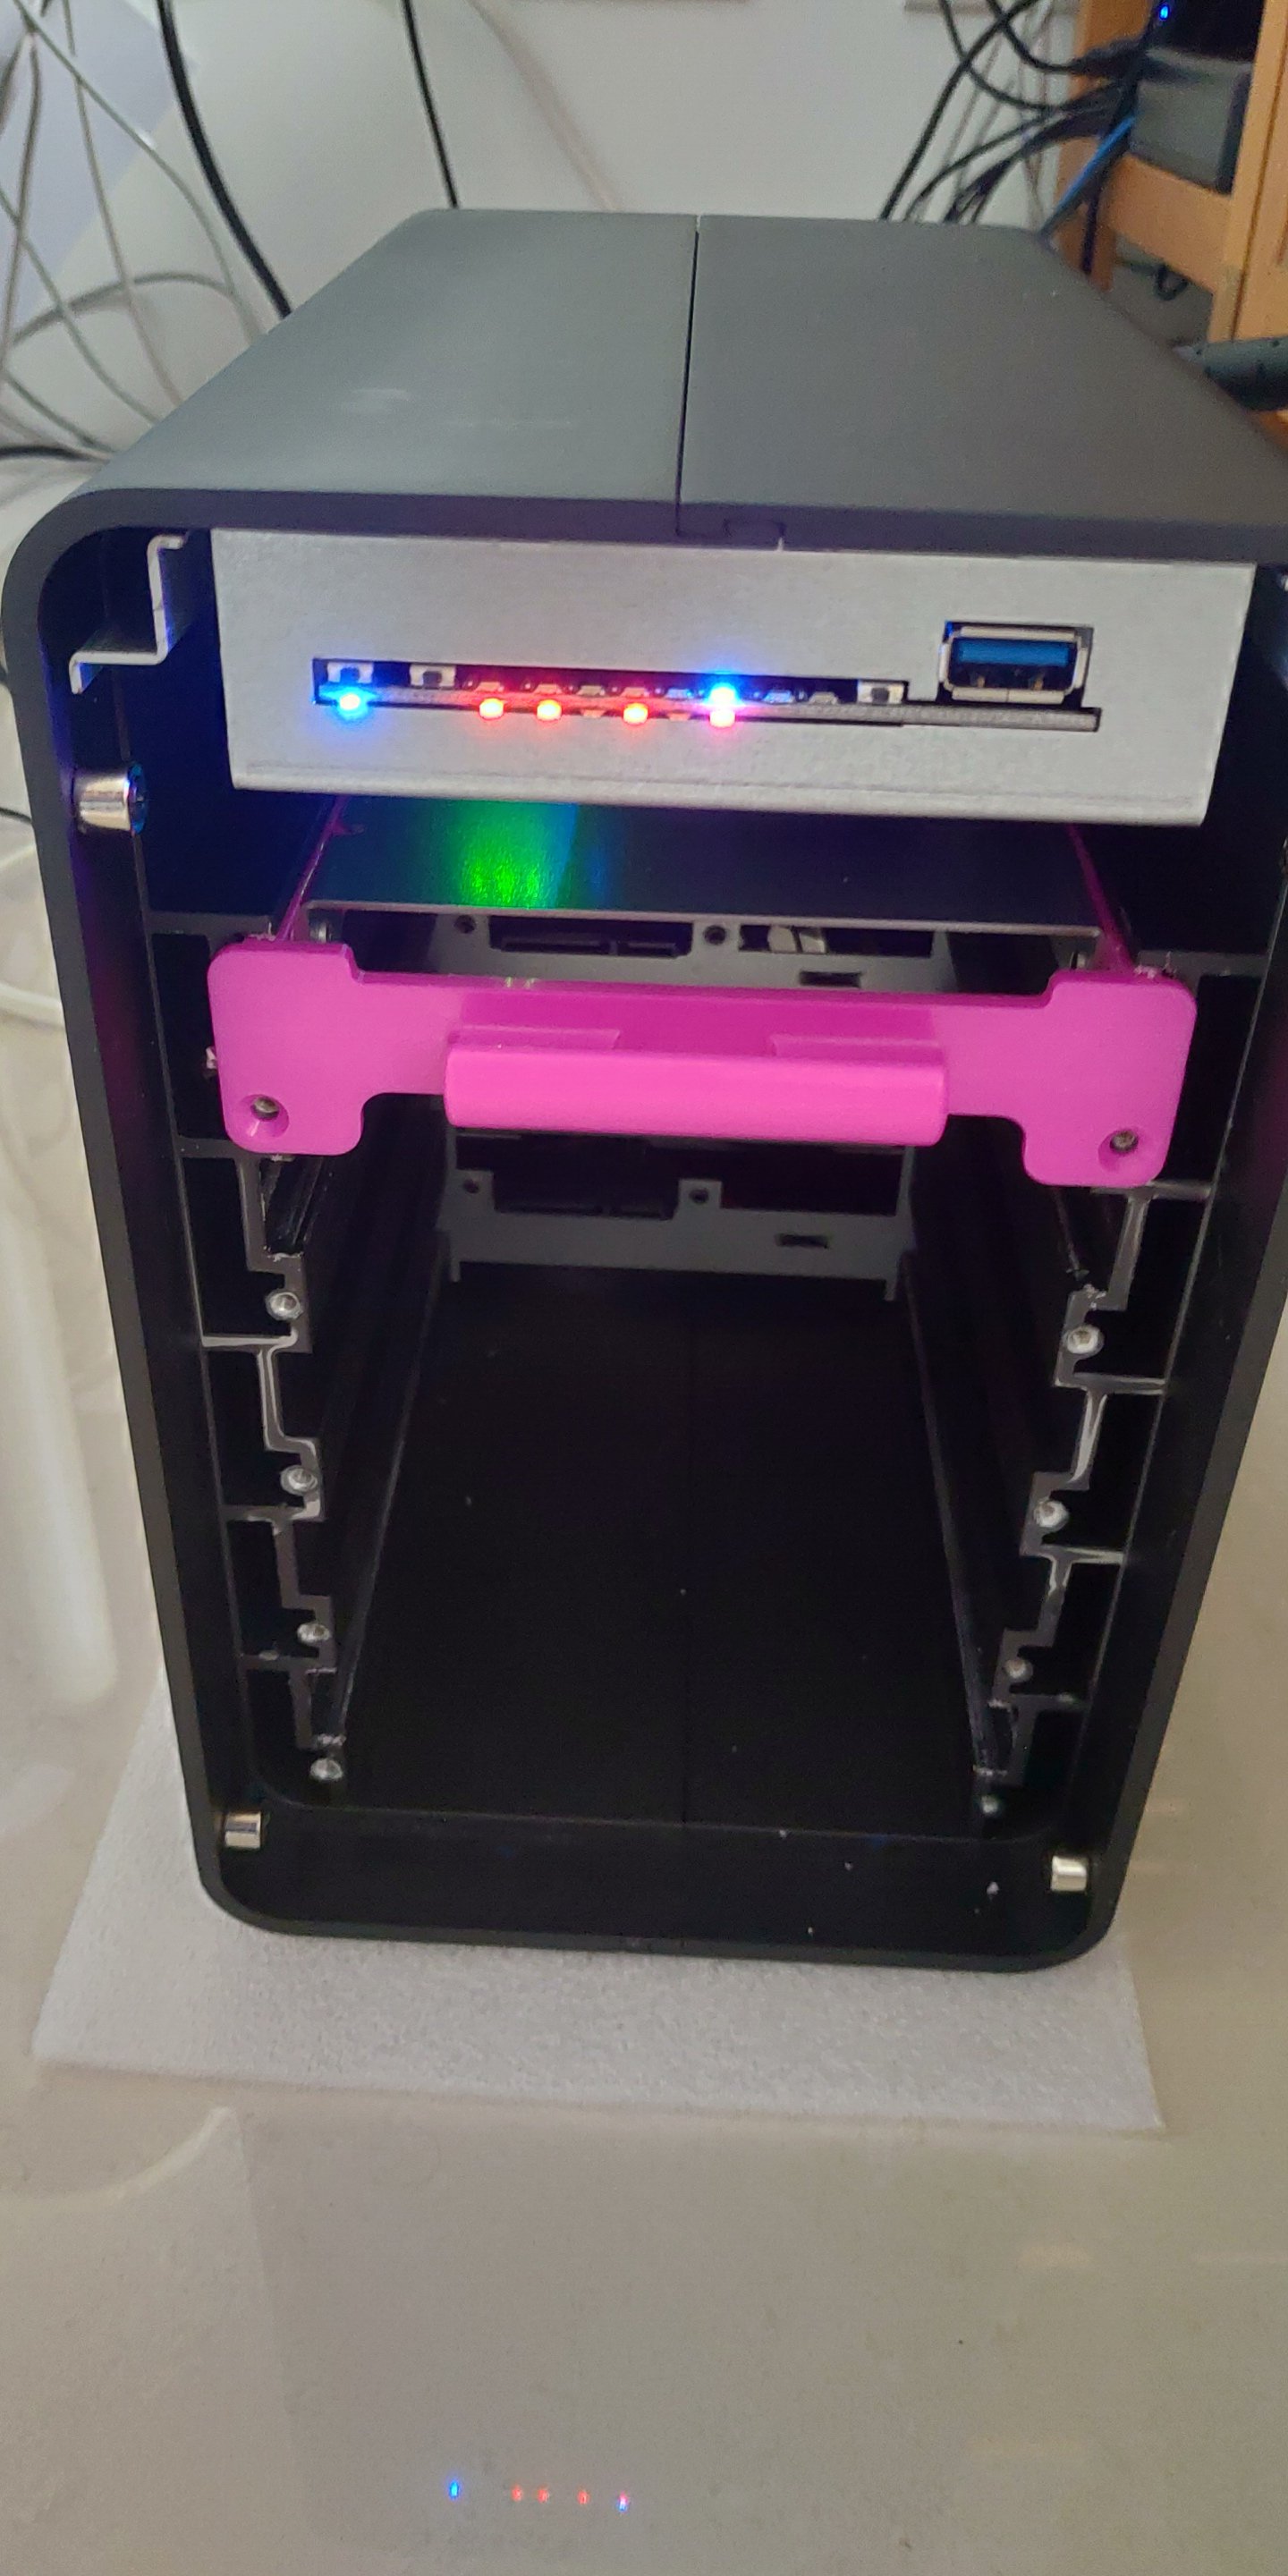
Just now, gprovost said:
Are all the HDD status LED (blue) doing this dimming in and out simultaneously ?
Hi @gprovost, replies have crossed.
Yes, all the HDD status LEDs are cycling simultaneously. For the HDD with activity, it's still blinking with activity. I cannot make out if the actitivy LED itself is also cycling, my eyes are a bit too old for that.
Groetjes,
-
Hi,
Only the USB HDD (sdc) is configured to have spindown after some minutes, the others were not explicitly configured to enter either standby/sleep mode. Note that all of the HDD status LEDs show are cycling, not just a few.
hdparm shows the following strange values:
Device: Used as: Interface: Media: hdparm -C says: sdb rootfs USB USB stick drive state is: standby sdg swap SATA SSD drive state is: active/idle sda data0 SATA HDD drive state is: active/idle sdd data1 SATA HDD drive state is: active/idle sde data2 SATA HDD drive state is: active/idle sdf data3 SATA HDD drive state is: active/idle sdc parity0 USB HDD drive state is: active/idle I've never heard that a USB media stick can be put in standby mode? Even more strange is that '/' is running off of this USB device.
See below for more details.
SpoilerAHCI link power modes are as follows:
root@kobol0:~# egrep . /sys/class/scsi_host/*/link_power_management_policy
/sys/class/scsi_host/host0/link_power_management_policy: med_power_with_dipm
/sys/class/scsi_host/host1/link_power_management_policy: med_power_with_dipm
/sys/class/scsi_host/host2/link_power_management_policy: med_power_with_dipm
/sys/class/scsi_host/host3/link_power_management_policy: med_power_with_dipm
/sys/class/scsi_host/host4/link_power_management_policy: med_power_with_dipm
USB stuff (whitespace added and fluff removed):
root@kobol0:~# lsusb -t
/:  Bus 02.Port 1: Dev 1, Class=root_hub, Driver=xhci-hcd/1p, 5000M
    |__ Port 1: Dev 2, If 0, Class=Hub, Driver=hub/4p, 5000M
        |__ Port 1: Dev 3, If 0, Class=Mass Storage, Driver=usb-storage, 5000M
        |__ Port 2: Dev 4, If 0, Class=Mass Storage, Driver=usb-storage, 5000M
        |__ Port 4: Dev 5, If 0, Class=Vendor Specific Class, Driver=r8152, 5000M


root@kobol0:~# egrep . /sys/bus/usb/devices/*/power/control
/sys/bus/usb/devices/2-1/power/control:   auto
/sys/bus/usb/devices/2-1.1/power/control: auto
/sys/bus/usb/devices/2-1.2/power/control: auto
/sys/bus/usb/devices/2-1.4/power/control: auto
/sys/bus/usb/devices/usb1/power/control:  auto
/sys/bus/usb/devices/usb2/power/control:  auto

root@kobol0:~# lsusb
Bus 002 Device 003: ID 0781:5583 SanDisk Corp. Ultra Fit
Groetjes,
-
Hi,
Not sure if anyone has seen the same as I have been seen on my box; the HDD status LEDs are cycling in brightness, from 0% to 100% and back to 0% continuously. It's a smooth transition, no flashy circus.
I might have triggered this myself, but no idea how? Is this is a new feature? I tried to make some video of it, but it is quite difficult to see.
Groetjes,
-
6 minutes ago, JeffDwork said:
What are you all using for stress testing? Is there something better than iozone ? I don't have an array - just 5 individual disks - to be accessed by NFS and samba. I'm running plain armbian ubuntu. I really want to run this thing before I trust it with my data.
Thanks,
Jeff
Hi @JeffDwork,
I have used snapraid for testing, and running md5sums on all the content on the disks. Once to 'sync' or create MD5 hashes, subsequent runs to 'scrub' or check MD5 hashes. This gave me some warm feeling on how fast the system can calculate hashes and how fast the disk I/O is. This would then give me a good indication on scheduling maintenance actions, e.g. if 'scrub' takes 12 hours, need to make sure it does not push out or overlap other scheduled maintenance actions etc.
Overall, it will depend on what you care about the most; CPU performance/temperature, disk throughput, filesystem reliability, system stability or perhaps other factors.
Groetjes,
-
Hi,
17 hours ago, gprovost said:Well according to your ethtool ouput. Your switch only advertise 10 and 100baseT/Full. What switch model it is ?
I think you need to try again with the other switch you mentioned about. What switch model it is ?
Both are Zyxel switches, one is 16 ports GS1100 -16 and the other is 8 ports GS-108Bv3. Both are Gbps capable, as shown by other devices connected to the same switch:
Helios4:
Link partner advertised link modes:  10baseT/Half 10baseT/Full
                                     100baseT/Half 100baseT/Full
                                     1000baseT/Full
Just now, I tried yet another set of cables to connect to the Helios64 box, and it seems I have bought several batches of cat "5e" cables, with stress on "5e". Looks like a cabling issue still. I never noticed this, as most are connected to either Raspberry Pi2b or OrangePi zero devices (see ethtool output from one of the Pis below, connected to the same 16ports Gbps capable switch). I already ordered another batch of [apparently] shielded cat 6 cables, hopefully they are indeed shielded, cat 6 and not cat "6".Raspberry Pi2b:
Link partner advertised link modes:  10baseT/Half 10baseT/Full
                                     100baseT/Half 100baseT/Full
Please disregard my previous post.
Thanks,Groetjes,
-
Spoiler
Hi all,
A few days ago, I started my backup scripting on the Helios64 box. This is an rsync that will grab files from the Helios4 box and stores it on local disk. To my surprise, the backup took over 20 hours. At the time I did not think much of it, as it was a new month, and every new month means a new non-incremental backup will take place.
Yesterday I decided to have a closer look at what had happened. To my surprise, I found that eth0 was running at 100Mbps?
SpoilerSettings for eth0: Supported ports: [ TP MII ] Supported link modes: 10baseT/Half 10baseT/Full 100baseT/Half 100baseT/Full 1000baseT/Full Supported pause frame use: Symmetric Receive-only Supports auto-negotiation: Yes Supported FEC modes: Not reported Advertised link modes: 10baseT/Half 10baseT/Full 100baseT/Half 100baseT/Full 1000baseT/Full Advertised pause frame use: Symmetric Receive-only Advertised auto-negotiation: Yes Advertised FEC modes: Not reported Link partner advertised link modes: 10baseT/Half 10baseT/Full 100baseT/Half 100baseT/Full Link partner advertised pause frame use: Symmetric Link partner advertised auto-negotiation: Yes Link partner advertised FEC modes: Not reported Speed: 100Mb/s Duplex: Full Port: MII PHYAD: 0 Transceiver: internal Auto-negotiation: on Supports Wake-on: ug Wake-on: d Current message level: 0x0000003f (63) drv probe link timer ifdown ifup Link detected: yesNow I know for a fact that the switch connected to it, is capable of 1Gbps. After changing the cabling, I managed to rule out at least all the cables I have lying around - as all reported 100Mbps, short cables, long cables, cables that were working fine in the Helios4 box.
Next up, was to try an intermediate 1Gbps switch: This worked; Helios64 showed 1000Mbps speed - but - it did not show any network activity, the box was unreachable from the outside and the box was not able to reach anything on the outside.
After connecting the original cable back, it flipped to 100Mbps again, but at least connectivity was there.
Anyone have any idea on what to check next?
Thanks,
Groetjes, -
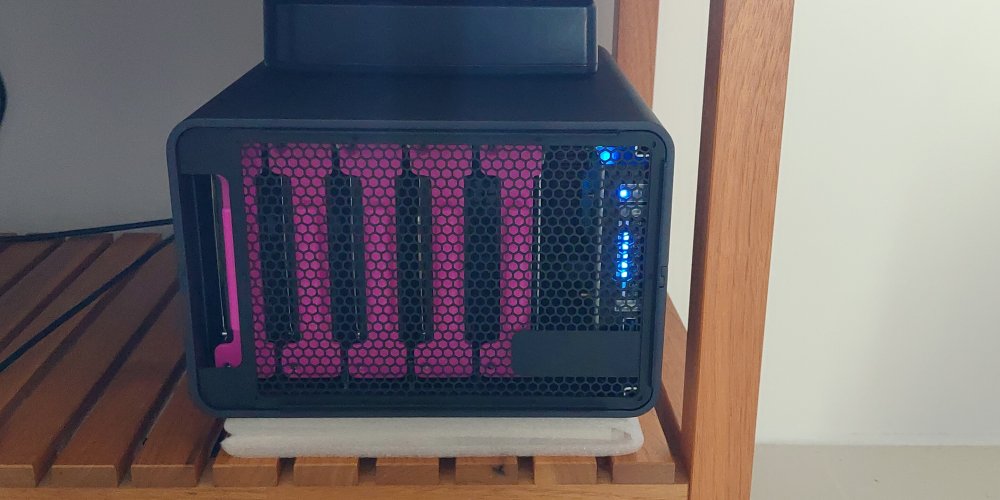
Hi,
Are there any plans to make a toddler-proof version of the front grille, that will cover the buttons? Currently I just applied some lofi containment by simply flipping the front grille so it covers the front panel. Perhaps some snap-in plexiglass for the panel cutout, with a little doorknob type of thing?
Have not checked if the buttons can be disabled in software yet (https://wiki.kobol.io/helios64/button/), perhaps the PMIC can be programmed in user space?
Groetjes,
-
Hi,
After fixing the LED issue, I started to try out if snapraid is working. On the Helios4 snapraid ran into some issues due to the amount of files available on the snapraid "array"; 32bit addressing constraints caused snapraid to bork out regularly. No matter the snapraid configuration tweaking/trial & error applied, it kept on requiring more than 4GB of addressing space.
After running "sync" and "scrub" for the first time on the Helios64, I noticed a more than comfortable amount of alleged ata I/O errors like below:
ata1.00: failed command: READ FPDMA QUEUEDSpoilerOct 29 21:13:46 localhost kernel: [642537.722453] ata1.00: exception Emask 0x2 SAct 0x80018000 SErr 0x400 action 0x6 Oct 29 21:13:46 localhost kernel: [642537.723136] ata1.00: irq_stat 0x08000000 Oct 29 21:13:46 localhost kernel: [642537.723514] ata1: SError: { Proto } Oct 29 21:13:46 localhost kernel: [642537.723854] ata1.00: failed command: READ FPDMA QUEUED Oct 29 21:13:46 localhost kernel: [642537.724351] ata1.00: cmd 60/00:78:40:bf:22/02:00:1e:00:00/40 tag 15 ncq dma 262144 in Oct 29 21:13:46 localhost kernel: [642537.724351] res 40/00:f8:58:23:61/00:00:00:00:00/40 Emask 0x2 (HSM violation) Oct 29 21:13:46 localhost kernel: [642537.725771] ata1.00: status: { DRDY } Oct 29 21:13:46 localhost kernel: [642537.726120] ata1.00: failed command: READ FPDMA QUEUED Oct 29 21:13:46 localhost kernel: [642537.726685] ata1.00: cmd 60/00:80:40:c1:22/02:00:1e:00:00/40 tag 16 ncq dma 262144 in Oct 29 21:13:46 localhost kernel: [642537.726685] res 40/00:f8:58:23:61/00:00:00:00:00/40 Emask 0x2 (HSM violation) Oct 29 21:13:46 localhost kernel: [642537.728134] ata1.00: status: { DRDY } Oct 29 21:13:46 localhost kernel: [642537.728485] ata1.00: failed command: READ FPDMA QUEUED Oct 29 21:13:46 localhost kernel: [642537.728989] ata1.00: cmd 60/08:f8:58:23:61/00:00:00:00:00/40 tag 31 ncq dma 4096 in Oct 29 21:13:46 localhost kernel: [642537.728989] res 40/00:f8:58:23:61/00:00:00:00:00/40 Emask 0x2 (HSM violation) Oct 29 21:13:46 localhost kernel: [642537.730432] ata1.00: status: { DRDY } Oct 29 21:13:46 localhost kernel: [642537.730792] ata1: hard resetting link Oct 29 21:13:47 localhost kernel: [642538.206413] ata1: SATA link up 6.0 Gbps (SStatus 133 SControl 300) Oct 29 21:13:47 localhost kernel: [642538.207993] ata1.00: configured for UDMA/133 Oct 29 21:13:47 localhost kernel: [642538.208300] sd 0:0:0:0: [sdb] tag#15 UNKNOWN(0x2003) Result: hostbyte=0x00 driverbyte=0x08 cmd_age=0s Oct 29 21:13:47 localhost kernel: [642538.208319] sd 0:0:0:0: [sdb] tag#15 Sense Key : 0x5 [current] Oct 29 21:13:47 localhost kernel: [642538.208336] sd 0:0:0:0: [sdb] tag#15 ASC=0x21 ASCQ=0x4 Oct 29 21:13:47 localhost kernel: [642538.208355] sd 0:0:0:0: [sdb] tag#15 CDB: opcode=0x88 88 00 00 00 00 00 1e 22 bf 40 00 00 02 00 00 00 Oct 29 21:13:47 localhost kernel: [642538.208373] blk_update_request: I/O error, dev sdb, sector 505593664 op 0x0:(READ) flags 0x80700 phys_seg 64 prio class 0 Oct 29 21:13:47 localhost kernel: [642538.209577] sd 0:0:0:0: [sdb] tag#16 UNKNOWN(0x2003) Result: hostbyte=0x00 driverbyte=0x08 cmd_age=0s Oct 29 21:13:47 localhost kernel: [642538.209595] sd 0:0:0:0: [sdb] tag#16 Sense Key : 0x5 [current] Oct 29 21:13:47 localhost kernel: [642538.209610] sd 0:0:0:0: [sdb] tag#16 ASC=0x21 ASCQ=0x4 Oct 29 21:13:47 localhost kernel: [642538.209626] sd 0:0:0:0: [sdb] tag#16 CDB: opcode=0x88 88 00 00 00 00 00 1e 22 c1 40 00 00 02 00 00 00 Oct 29 21:13:47 localhost kernel: [642538.209642] blk_update_request: I/O error, dev sdb, sector 505594176 op 0x0:(READ) flags 0x80700 phys_seg 63 prio class 0 Oct 29 21:13:47 localhost kernel: [642538.210826] ata1: EH completeAfter some searching around on the internet, it appeared that limiting SATA link speed, these errors can be prevented. Checking other server deployments, this behavior was also seen in a 8 disk mdadm RAID setup, whre [new] WD blue disks also show these READ FPDMA QUEUED erros, which disappeared after ata error handling starts to turn down SATA link speeds to 3Gbps.
To test this out, I added the following to /boot/armbianEnv.txt:
extraargs=libata.force=3.0Upon rebooting the box, it appears that libata indeed limited the SATA link speed for all drives to 3Gbps:
Oct 29 22:01:59 localhost kernel: [    3.143259] ata1: FORCE: PHY spd limit set to 3.0Gbps
Oct 29 22:01:59 localhost kernel: [    3.143728] ata1: SATA max UDMA/133 abar m8192@0xfa010000 port 0xfa010100 irq 238
Oct 29 22:01:59 localhost kernel: [    3.143736] ata2: FORCE: PHY spd limit set to 3.0Gbps
Oct 29 22:01:59 localhost kernel: [    3.144192] ata2: SATA max UDMA/133 abar m8192@0xfa010000 port 0xfa010180 irq 239
Oct 29 22:01:59 localhost kernel: [    3.144199] ata3: FORCE: PHY spd limit set to 3.0Gbps
Oct 29 22:01:59 localhost kernel: [    3.144654] ata3: SATA max UDMA/133 abar m8192@0xfa010000 port 0xfa010200 irq 240
Oct 29 22:01:59 localhost kernel: [    3.144661] ata4: FORCE: PHY spd limit set to 3.0Gbps
Oct 29 22:01:59 localhost kernel: [    3.145115] ata4: SATA max UDMA/133 abar m8192@0xfa010000 port 0xfa010280 irq 241
Oct 29 22:01:59 localhost kernel: [    3.145122] ata5: FORCE: PHY spd limit set to 3.0Gbps
Oct 29 22:01:59 localhost kernel: [    3.145603] ata5: SATA max UDMA/133 abar m8192@0xfa010000 port 0xfa010300 irq 242
Redoing the snapraid scrub, the READ FPDMA QUEUED errors indeed had disappeared. As the disks in the box are WD red HDDs, there is not really a point of having 6Gbps (~600MB/s) SATA linkspeed anyway, disk performance is rated at less than 300MB/s throughput. (Occasionally it tips sustained sequential reads around 130MiB/s for large files.)
Note that YMMV.
Groetjes,
-
7 hours ago, gprovost said:
It might be that one side of front panel (the side with red LEDs) touch a bit the metal opening shorting the LED therefore lighting them up.
D'oh. Looks like that is indeed the case. Will plan to try to add some clearance for the front panel during the next scheduled down activity
")
-
Hi all,
In the last few days, finally found some time to migrate my helios4 backup node to helios64. In the beginning I had some trouble accessing the serial console, but this was resolved in the end.
SpoilerConnected the USB-C - USB-A cable to a USB hub, connected to a RaspberryPi (2B). RaspberryPi detected USB/serial converter:
[...] kernel: [869447.887756] usb 1-1.4.4.3: FTDI USB Serial Device converter now attached to ttyUSB4

/:  Bus 01.Port 1: Dev 1, Class=root_hub, Driver=dwc_otg/1p, 480M
   |__ Port 1: Dev 2, If 0, Class=Hub, Driver=hub/5p, 480M
       |__ Port 1: Dev 3, If 0, Class=Vendor Specific Class, Driver=smsc95xx, 480M
       |__ Port 4: Dev 4, If 0, Class=Hub, Driver=hub/4p, 480M
           |__ Port 4: Dev 8, If 0, Class=Hub, Driver=hub/4p, 480M
               |__ Port 3: Dev 11, If 0, Class=Vendor Specific Class, Driver=ftdi_sio, 12M
               |__ Port 1: Dev 9, If 0, Class=Vendor Specific Class, Driver=ftdi_sio, 12M
           |__ Port 2: Dev 6, If 0, Class=Vendor Specific Class, Driver=pl2303, 12M
           |__ Port 1: Dev 5, If 0, Class=Vendor Specific Class, Driver=pl2303, 12M

Bus 001 Device 011: ID 0403:6015 Future Technology Devices International, Ltd Bridge(I2C/SPI/UART/FIFO)
Connected serial console using "screen /dev/ttyUSB4 1500000" but no output seen. (Mapping is sound, see output of syslog/lsusb. One helios4 is disconnected at the moment, so only 3 out of 4 are showing in lsusb at the moment.)
Thought it had to do with the USB hub on the Pi, as there are 4 other USB-to-serial converters connected to it and I am running the hub without external power. Used my laptop, also using screen, but still no output seen.
Then switched back to the Pi and used picocom (as mentioned on the wiki), but I could not select 1500000 baudrate?
$ picocom /dev/ttyUSB4 -b 1500000
picocom v1.7

port is        : /dev/ttyUSB4
flowcontrol    : none
baudrate is    : 1500000
parity is      : none
databits are   : 8
escape is      : C-a
[...]
FATAL: failed to add device /dev/ttyUSB4: Invalid baud rate
In the end I used minicom and oddly enough, output was seen. Did not look any further (lazy and working on getting ansible configuration working with the new helios64 setup).I want to ask if anyone has issues with the red disk status LEDs? As it seems like 3 of them are not responding to setting values in /sys/class/leds/helios64:red:ata?-err/brightness. Looks a bit odd with allmost all of the error LEDs on.
Groetjes,


Helios4 - Cryptographic Engines And Security Accelerator (CESA) Benchmarking
in Marvell mvebu
Posted
@jsr, can you also check /proc/cryptinfo ? If I remember correctly, the mv/marvell module should show up in cryptinfo.
Edit: Also noticed you are LUKSing an mmc device. Not sure about the speed of device used in your setup, but my SD cards hardly reach 30MiB/s, even if CESA would work. Your throughput might be limited by additional bottleneck.