

grep
-
Posts
36 -
Joined
-
Last visited
Content Type
Forums
Store
Crowdfunding
Applications
Events
Raffles
Community Map
Posts posted by grep
-
-
Spoiler
[58531.860637] lowmem_reserve[]: 0 0 0 [58531.860654] Normal: 56*4kB (H) 44*8kB (H) 48*16kB (H) 37*32kB (H) 14*64kB (H) 1*128kB (H) 0*256kB 0*512kB 0*1024kB 0*2048kB 0*4096kB = 3552kB [58531.860733] HighMem: 27*4kB (UM) 42*8kB (C) 1*16kB (C) 0*32kB 0*64kB 0*128kB 0*256kB 0*512kB 0*1024kB 0*2048kB 0*4096kB = 460kB [58531.860786] 304403 total pagecache pages [58531.860790] 15267 pages in swap cache [58531.860794] Swap cache stats: add 382457, delete 367190, find 125239/202183 [58531.860798] Free swap = 1630472kB [58531.860801] Total swap = 2097148kB [58531.860805] 518656 pages RAM [58531.860809] 322048 pages HighMem/MovableOnly [58531.860813] 8201 pages reserved [58531.860817] 32768 pages cma reserved [58531.860825] swapper/7: page allocation failure: order:0, mode:0x2080020(GFP_ATOMIC) [58531.860839] CPU: 7 PID: 0 Comm: swapper/7 Not tainted 4.9.61-odroidxu4 #2 [58531.860844] Hardware name: SAMSUNG EXYNOS (Flattened Device Tree) [58531.860852] [<c021b299>] (unwind_backtrace) from [<c021831f>] (show_stack+0xb/0xc) [58531.860861] [<c021831f>] (show_stack) from [<c05765f7>] (dump_stack+0x67/0x74) [58531.860869] [<c05765f7>] (dump_stack) from [<c02ae9af>] (warn_alloc+0xbf/0xdc) [58531.860877] [<c02ae9af>] (warn_alloc) from [<c02aecc7>] (__alloc_pages_nodemask+0x29f/0x9cc) [58531.860885] [<c02aecc7>] (__alloc_pages_nodemask) from [<c02af50d>] (__alloc_page_frag+0xcd/0xdc) [58531.860893] [<c02af50d>] (__alloc_page_frag) from [<c07a6ca9>] (__napi_alloc_skb+0x71/0xb0) [58531.860901] [<c07a6ca9>] (__napi_alloc_skb) from [<c067eb3f>] (r8152_poll+0x227/0xacc) [58531.860909] [<c067eb3f>] (r8152_poll) from [<c07b0ee5>] (net_rx_action+0x1ad/0x234) [58531.860916] [<c07b0ee5>] (net_rx_action) from [<c022d129>] (__do_softirq+0x9d/0x194) [58531.860922] [<c022d129>] (__do_softirq) from [<c022d429>] (irq_exit+0x8d/0xdc) [58531.860930] [<c022d429>] (irq_exit) from [<c025fb1f>] (__handle_domain_irq+0x3f/0x7c) [58531.860936] [<c025fb1f>] (__handle_domain_irq) from [<c02013b7>] (gic_handle_irq+0x43/0x78) [58531.860942] [<c02013b7>] (gic_handle_irq) from [<c0218bd3>] (__irq_svc+0x53/0x94) [58531.860946] Exception stack(0xee8cbf88 to 0xee8cbfd0) [58531.860951] bf80: 00000001 00000000 00000000 c02240a1 ee8ca000 c100313c [58531.860956] bfa0: 00000080 c1003190 00000000 00000000 c0e650b8 c1003198 c107f4e8 ee8cbfd8 [58531.860961] bfc0: c0216245 c0216246 40000033 ffffffff [58531.860968] [<c0218bd3>] (__irq_svc) from [<c0216246>] (arch_cpu_idle+0x22/0x24) [58531.860976] [<c0216246>] (arch_cpu_idle) from [<c0258997>] (cpu_startup_entry+0x123/0x170) [58531.860982] [<c0258997>] (cpu_startup_entry) from [<40201491>] (0x40201491) [58531.860986] Mem-Info: [58531.860994] active_anon:76119 inactive_anon:82136 isolated_anon:0 active_file:207652 inactive_file:81195 isolated_file:0 unevictable:64 dirty:6436 writeback:15443 unstable:0 slab_reclaimable:7317 slab_unreclaimable:13754 mapped:3882 shmem:186 pagetables:1576 bounce:0 free:997 free_pcp:544 free_cma:70 [58531.861003] Node 0 active_anon:304476kB inactive_anon:328544kB active_file:830608kB inactive_file:324780kB unevictable:256kB isolated(anon):0kB isolated(file):0kB mapped:15528kB dirty:25744kB writeback:61772kB shmem:744kB writeback_tmp:0kB unstable:0kB pages_scanned:3984 all_unreclaimable? no [58531.861011] Normal free:3476kB min:3452kB low:4312kB high:5172kB active_anon:58072kB inactive_anon:89612kB active_file:239988kB inactive_file:143312kB unevictable:0kB writepending:87140kB present:786432kB managed:753628kB mlocked:0kB slab_reclaimable:29268kB slab_unreclaimable:55016kB kernel_stack:2416kB pagetables:2740kB bounce:0kB free_pcp:1908kB local_pcp:0kB free_cma:0kB [58531.861015] lowmem_reserve[]: 0 9040 9040 [58531.861036] HighMem free:512kB min:512kB low:1848kB high:3184kB active_anon:246404kB inactive_anon:238932kB active_file:590684kB inactive_file:181680kB unevictable:256kB writepending:388kB present:1288192kB managed:1288192kB mlocked:256kB slab_reclaimable:0kB slab_unreclaimable:0kB kernel_stack:0kB pagetables:3564kB bounce:0kB free_pcp:268kB local_pcp:0kB free_cma:280kB [58531.861039] lowmem_reserve[]: 0 0 0 [58531.861054] Normal: 56*4kB (H) 44*8kB (H) 48*16kB (H) 37*32kB (H) 14*64kB (H) 1*128kB (H) 0*256kB 0*512kB 0*1024kB 0*2048kB 0*4096kB = 3552kB [58531.861118] HighMem: 27*4kB (UM) 42*8kB (C) 1*16kB (C) 0*32kB 0*64kB 0*128kB 0*256kB 0*512kB 0*1024kB 0*2048kB 0*4096kB = 460kB [58531.861184] 304362 total pagecache pages [58531.861189] 15251 pages in swap cache [58531.861194] Swap cache stats: add 382459, delete 367208, find 125239/202183 [58531.861198] Free swap = 1630464kB [58531.861203] Total swap = 2097148kB [58531.861207] 518656 pages RAM [58531.861213] 322048 pages HighMem/MovableOnly [58531.861217] 8201 pages reserved [58531.861222] 32768 pages cma reserved
In short: disabling zram-config.service and using "pure partition swap via ssd" causes problems
HC-1, armbianmonitor -u = http://sprunge.us/aRZc
UPDATE: "New year problems party" continues:
Spoiler[63786.258447] lowmem_reserve[]: 0 0 0 [63786.258463] Normal: 56*4kB (H) 40*8kB (H) 48*16kB (H) 37*32kB (H) 14*64kB (H) 1*128kB (H) 0*256kB 0*512kB 0*1024kB 0*2048kB 0*4096kB = 3520kB [63786.258522] HighMem: 2295*4kB (UMC) 334*8kB (MC) 3*16kB (C) 0*32kB 0*64kB 0*128kB 0*256kB 0*512kB 0*1024kB 0*2048kB 0*4096kB = 11900kB [63786.258572] 299158 total pagecache pages [63786.258575] 11127 pages in swap cache [63786.258579] Swap cache stats: add 409233, delete 398106, find 133227/215304 [63786.258583] Free swap = 1580692kB [63786.258586] Total swap = 2097148kB [63786.258589] 518656 pages RAM [63786.258593] 322048 pages HighMem/MovableOnly [63786.258596] 8201 pages reserved [63786.258599] 32768 pages cma reserved [63787.042853] slab_out_of_memory: 878 callbacks suppressed [63787.042857] SLUB: Unable to allocate memory on node -1, gfp=0x2080020(GFP_ATOMIC) [63787.042863] cache: kmalloc-192, object size: 192, buffer size: 192, default order: 0, min order: 0 [63787.042868] node 0: slabs: 389, objs: 8169, free: 0 [63787.046695] SLUB: Unable to allocate memory on node -1, gfp=0x2080020(GFP_ATOMIC) [63787.046702] cache: kmalloc-192, object size: 192, buffer size: 192, default order: 0, min order: 0 [63787.046708] node 0: slabs: 389, objs: 8169, free: 0 [63787.048040] SLUB: Unable to allocate memory on node -1, gfp=0x2080020(GFP_ATOMIC) [63787.048045] cache: kmalloc-192, object size: 192, buffer size: 192, default order: 0, min order: 0 [63787.048049] node 0: slabs: 389, objs: 8169, free: 0 [63787.049142] SLUB: Unable to allocate memory on node -1, gfp=0x2080020(GFP_ATOMIC) [63787.049149] cache: kmalloc-192, object size: 192, buffer size: 192, default order: 0, min order: 0 [63787.049154] node 0: slabs: 389, objs: 8169, free: 0 [63787.050405] SLUB: Unable to allocate memory on node -1, gfp=0x2080020(GFP_ATOMIC) [63787.050410] cache: kmalloc-192, object size: 192, buffer size: 192, default order: 0, min order: 0 [63787.050415] node 0: slabs: 389, objs: 8169, free: 0 [63787.055956] SLUB: Unable to allocate memory on node -1, gfp=0x2080020(GFP_ATOMIC) [63787.055961] cache: kmalloc-192, object size: 192, buffer size: 192, default order: 0, min order: 0 [63787.055966] node 0: slabs: 389, objs: 8169, free: 0 [63787.075953] SLUB: Unable to allocate memory on node -1, gfp=0x2080020(GFP_ATOMIC) [63787.075958] cache: kmalloc-192, object size: 192, buffer size: 192, default order: 0, min order: 0 [63787.075963] node 0: slabs: 389, objs: 8169, free: 0 [63787.095948] SLUB: Unable to allocate memory on node -1, gfp=0x2080020(GFP_ATOMIC) [63787.095953] cache: kmalloc-192, object size: 192, buffer size: 192, default order: 0, min order: 0 [63787.095957] node 0: slabs: 389, objs: 8169, free: 0 [63787.115953] SLUB: Unable to allocate memory on node -1, gfp=0x2080020(GFP_ATOMIC) [63787.115958] cache: kmalloc-192, object size: 192, buffer size: 192, default order: 0, min order: 0 [63787.115963] node 0: slabs: 389, objs: 8169, free: 0 [63787.135961] SLUB: Unable to allocate memory on node -1, gfp=0x2080020(GFP_ATOMIC) [63787.135967] cache: kmalloc-192, object size: 192, buffer size: 192, default order: 0, min order: 0 [63787.135973] node 0: slabs: 389, objs: 8169, free: 0armbianmonitor -u = http://sprunge.us/ZYLE
-
Has anyone tried to use a fan with Odroid HC-1 ? Too hot for my default load scenario (75..80 deg. cel.), even had to make an "ugly rack" (with hdd location below HC-1) to avoid hdd overheat and allow free airflow from heatsink. There are 2 "dot"-connectors marked "GND" and "12V"; looks like they are for external cooler, am i right ?
-
@Igor It's meaningless, because my "black cube PSU" provides OVERVOLTAGE by default (see image attached)
So, i'm just an "extremely lucky" one who got 2 unstable PSUs. Absolutely awesome.
Will wait for 'reference PSU'. @tkaiser
") i'll say it: ok, looks like you were right
i'll say it: ok, looks like you were right
So: most likely, the set of sporadic problems was caused by usage of 2(!) unstable (OVERVOLTAGED) PSU's one-by-one.

-
5 hours ago, tkaiser said:
You've still a corrupted btrfs filesystem
grep@orangepiprime:/home$ sudo btrfs scrub status /home scrub status for 835d7f1d-2047-47b1-9dcc-24bbc3be48c0 scrub started at Sun Dec 17 14:49:30 2017 and finished after 00:42:45 total bytes scrubbed: 94.53GiB with 0 errors grep@orangepiprime:/home$ df -h /home/ Filesystem Size Used Avail Use% Mounted on /dev/sda1 430G 96G 333G 23% /homestress --cpu 8 --io 4 --vm 2 --vm-bytes 128M --timeout 501s stress: info: [21289] dispatching hogs: 8 cpu, 4 io, 2 vm, 0 hdd stress: info: [21289] successful run completed in 501sSee no problem too (BTW, your SoC is really hot under stress, so my previous guess about SoC overheat looke more and more like wrong one):
SpoilerTime CPU load %cpu %sys %usr %nice %io %irq CPU C.St. 15:40:28: 1152MHz 9.65 29% 4% 13% 0% 10% 0% 41.3°C 0/8 15:40:34: 1152MHz 10.00 100% 41% 58% 0% 0% 0% 39.1°C 0/8 15:40:39: 1152MHz 10.76 100% 40% 59% 0% 0% 0% 42.4°C 0/8 15:40:45: 1152MHz 11.02 100% 41% 58% 0% 0% 0% 41.6°C 0/8 15:40:50: 1152MHz 11.26 100% 40% 59% 0% 0% 0% 39.1°C 0/8 15:40:56: 1152MHz 11.48 100% 41% 58% 0% 0% 0% 42.5°C 0/8 15:41:01: 1152MHz 11.68 100% 41% 58% 0% 0% 0% 42.6°C 0/8 15:41:07: 1152MHz 11.87 100% 40% 59% 0% 0% 0% 43.2°C 0/8 15:41:12: 1152MHz 12.04 100% 40% 59% 0% 0% 0% 42.5°C 0/8 15:41:18: 1152MHz 12.20 100% 41% 58% 0% 0% 0% 43.8°C 0/8 15:41:23: 1152MHz 12.34 100% 42% 57% 0% 0% 0% 41.7°C 0/8 15:41:29: 1152MHz 12.67 100% 41% 58% 0% 0% 0% 39.2°C 0/8 15:41:34: 1152MHz 12.78 100% 41% 58% 0% 0% 0% 42.1°C 0/8 15:41:40: 1152MHz 12.88 100% 41% 58% 0% 0% 0% 40.2°C 0/8 Time CPU load %cpu %sys %usr %nice %io %irq CPU C.St. 15:41:46: 1152MHz 12.97 100% 41% 58% 0% 0% 0% 43.3°C 0/8 15:41:51: 1152MHz 13.05 100% 41% 58% 0% 0% 0% 44.0°C 0/8 15:41:57: 1152MHz 13.20 100% 41% 58% 0% 0% 0% 42.4°C 0/8 15:42:02: 1152MHz 13.27 100% 41% 58% 0% 0% 0% 44.3°C 0/8 15:42:08: 1152MHz 13.33 100% 41% 58% 0% 0% 0% 42.8°C 0/8 15:42:13: 1152MHz 13.38 100% 41% 58% 0% 0% 0% 42.8°C 0/8 15:42:19: 1152MHz 13.55 100% 40% 59% 0% 0% 0% 42.4°C 0/8 15:42:25: 1152MHz 13.59 100% 41% 58% 0% 0% 0% 41.4°C 0/8 15:42:30: 1152MHz 13.62 100% 41% 58% 0% 0% 0% 42.5°C 0/8 15:42:36: 1152MHz 13.65 100% 42% 57% 0% 0% 0% 46.1°C 0/8 15:42:41: 1152MHz 13.68 100% 41% 58% 0% 0% 0% 44.2°C 0/8 15:42:47: 1152MHz 13.71 100% 42% 57% 0% 0% 0% 43.0°C 0/8 15:42:53: 1152MHz 13.73 100% 40% 59% 0% 0% 0% 40.3°C 0/8 15:42:58: 1152MHz 13.75 100% 41% 58% 0% 0% 0% 42.2°C 0/8 15:43:04: 1152MHz 13.77 100% 42% 57% 0% 0% 0% 43.3°C 0/8 Time CPU load %cpu %sys %usr %nice %io %irq CPU C.St. 15:43:09: 1152MHz 13.88 100% 41% 58% 0% 0% 0% 43.2°C 0/8 15:43:14: 1152MHz 13.89 100% 41% 58% 0% 0% 0% 45.3°C 0/8 15:43:20: 1152MHz 13.90 100% 41% 58% 0% 0% 0% 44.0°C 0/8 15:43:25: 1152MHz 13.91 100% 41% 58% 0% 0% 0% 44.3°C 0/8 15:43:31: 1152MHz 13.92 100% 40% 59% 0% 0% 0% 39.2°C 0/8 15:43:37: 1152MHz 13.92 100% 41% 58% 0% 0% 0% 45.5°C 0/8 15:43:42: 1152MHz 13.93 100% 41% 58% 0% 0% 0% 42.1°C 0/8 15:43:48: 1152MHz 13.93 100% 42% 57% 0% 0% 0% 45.9°C 0/8 15:43:53: 1152MHz 13.94 100% 41% 58% 0% 0% 0% 42.5°C 0/8 15:43:58: 1152MHz 13.94 100% 41% 58% 0% 0% 0% 44.2°C 0/8 15:44:04: 1152MHz 14.03 100% 41% 58% 0% 0% 0% 41.4°C 0/8 15:44:10: 1152MHz 14.02 100% 41% 58% 0% 0% 0% 43.9°C 0/8 15:44:15: 1152MHz 14.02 100% 40% 59% 0% 0% 0% 43.1°C 0/8 15:44:21: 1152MHz 14.02 100% 41% 58% 0% 0% 0% 42.7°C 0/8 15:44:26: 1152MHz 14.02 100% 40% 59% 0% 0% 0% 43.3°C 0/8 Time CPU load %cpu %sys %usr %nice %io %irq CPU C.St. 15:44:32: 1152MHz 14.02 100% 41% 58% 0% 0% 0% 41.9°C 0/8 15:44:37: 1152MHz 14.02 100% 41% 58% 0% 0% 0% 43.9°C 0/8 15:44:43: 1152MHz 14.01 100% 40% 59% 0% 0% 0% 43.0°C 0/8 15:44:48: 1152MHz 14.01 100% 41% 58% 0% 0% 0% 41.6°C 0/8 15:44:54: 1152MHz 14.08 100% 41% 58% 0% 0% 0% 42.7°C 0/8 15:45:00: 1152MHz 14.08 100% 41% 58% 0% 0% 0% 40.8°C 0/8 15:45:05: 1152MHz 14.07 100% 41% 58% 0% 0% 0% 45.7°C 0/8 15:45:11: 1152MHz 14.06 100% 41% 57% 0% 0% 0% 41.7°C 0/8 15:45:16: 1152MHz 14.06 100% 41% 58% 0% 0% 0% 44.2°C 0/8 15:45:22: 1152MHz 14.05 100% 40% 59% 0% 0% 0% 41.5°C 0/8 15:45:27: 1152MHz 14.05 100% 40% 59% 0% 0% 0% 43.1°C 0/8 15:45:33: 1152MHz 14.05 100% 41% 58% 0% 0% 0% 44.3°C 0/8 15:45:38: 1152MHz 14.04 100% 40% 59% 0% 0% 0% 44.8°C 0/8 15:45:44: 1152MHz 14.11 100% 41% 58% 0% 0% 0% 41.3°C 0/8 15:45:50: 1152MHz 14.10 100% 40% 59% 0% 0% 0% 43.6°C 0/8 Time CPU load %cpu %sys %usr %nice %io %irq CPU C.St. 15:45:55: 1152MHz 14.09 100% 41% 58% 0% 0% 0% 44.0°C 0/8 15:46:01: 1152MHz 14.08 100% 40% 59% 0% 0% 0% 41.7°C 0/8 15:46:06: 1152MHz 14.08 100% 41% 58% 0% 0% 0% 44.4°C 0/8 15:46:12: 1152MHz 14.07 100% 41% 58% 0% 0% 0% 44.6°C 0/8 15:46:17: 1152MHz 14.07 100% 41% 58% 0% 0% 0% 45.1°C 0/8 15:46:23: 1152MHz 14.06 100% 41% 58% 0% 0% 0% 41.9°C 0/8 15:46:28: 1152MHz 14.06 100% 41% 58% 0% 0% 0% 42.6°C 0/8 15:46:34: 1152MHz 14.12 100% 41% 57% 0% 0% 0% 43.0°C 0/8 15:46:40: 1152MHz 14.11 100% 41% 58% 0% 0% 0% 43.4°C 0/8 15:46:45: 1152MHz 14.10 100% 41% 58% 0% 0% 0% 43.0°C 0/8 15:46:51: 1152MHz 14.09 100% 41% 58% 0% 0% 0% 43.8°C 0/8 15:46:56: 1152MHz 14.08 100% 41% 58% 0% 0% 0% 44.2°C 0/8 15:47:02: 1152MHz 14.08 100% 41% 58% 0% 0% 0% 45.3°C 0/8 15:47:07: 1152MHz 14.07 100% 41% 58% 0% 0% 0% 43.8°C 0/8 15:47:13: 1152MHz 14.07 100% 41% 58% 0% 0% 0% 45.1°C 0/8 Time CPU load %cpu %sys %usr %nice %io %irq CPU C.St. 15:47:18: 1152MHz 14.06 100% 41% 58% 0% 0% 0% 43.7°C 0/8 15:47:24: 1152MHz 14.12 100% 41% 58% 0% 0% 0% 44.0°C 0/8 15:47:30: 1152MHz 14.11 100% 42% 57% 0% 0% 0% 42.4°C 0/8 15:47:35: 1152MHz 14.11 100% 42% 57% 0% 0% 0% 42.1°C 0/8 15:47:40: 1152MHz 12.98 2% 1% 1% 0% 0% 0% 28.9°C 0/8 15:47:45: 1152MHz 11.94 0% 0% 0% 0% 0% 0% 28.4°C 0/8 15:47:50: 1152MHz 10.98 0% 0% 0% 0% 0% 0% 26.0°C 0/8 15:47:55: 1152MHz 10.10 0% 0% 0% 0% 0% 0% 26.9°C 0/8 15:48:01: 1152MHz 9.29 0% 0% 0% 0% 0% 0% 22.7°C 0/8 15:48:06: 1152MHz 8.55 0% 0% 0% 0% 0% 0% 25.4°C 0/8 15:48:11: 1152MHz 7.86 0% 0% 0% 0% 0% 0% 22.3°C 0/8 15:48:16: 1152MHz 7.23 0% 0% 0% 0% 0% 0% 23.0°C 0/8But i will replace PSU with "black cube" and will "just watch if something strange happen".
After that, seems like the best i can do is to wait for "reference PSU" from Xunlong (but HC-1 will arrive earlier some maybe i just will forget OPi Prime as a nightmare).
-
@tkaiser @chwe @Igor @TonyMac32
Sorry for interrupt, but this one does not look for me as the same PSU problem (i turned off all except monerod, so no CPU/IO load at all; http://sprunge.us/RGLj ).
Should i start new topic or log is enough for you to investigate it "one day"?
Spoiler[80002.208738] INFO: rcu_sched self-detected stall on CPU [80002.213897] 0-...: (1 GPs behind) idle=c1a/140000000000001/0 softirq=1937240/1937343 fqs=2622 [80002.216730] INFO: rcu_sched detected stalls on CPUs/tasks: [80002.216738] 0-...: (1 GPs behind) idle=c1a/140000000000001/0 softirq=1937240/1937343 fqs=2622 [80002.216739] (detected by 2, t=5252 jiffies, g=1130687, c=1130686, q=1361) [80002.216746] Task dump for CPU 0: [80002.216748] monerod R running task 0 15206 15191 0x0000000a [80002.216755] Call trace: [80002.216769] [<ffff000008084e48>] __switch_to+0x98/0xb0 [80002.216777] [<ffff00000839e5dc>] btrfs_buffer_uptodate+0x54/0x78 [80002.216782] [<0000000000000019>] 0x19 [80002.243602] (t=5258 jiffies g=1130687 c=1130686 q=1361) [80002.248995] Task dump for CPU 0: [80002.248997] monerod R running task 0 15206 15191 0x0000000a [80002.249003] Call trace: [80002.249009] [<ffff0000080884d8>] dump_backtrace+0x0/0x3a8 [80002.249014] [<ffff000008088894>] show_stack+0x14/0x20 [80002.249020] [<ffff0000080d6b60>] sched_show_task+0x170/0x198 [80002.249024] [<ffff0000080d7b58>] dump_cpu_task+0x40/0x50 [80002.249030] [<ffff0000081085ac>] rcu_dump_cpu_stacks+0x94/0xd8 [80002.249034] [<ffff000008107b5c>] rcu_check_callbacks+0x564/0x788 [80002.249040] [<ffff00000810b6e4>] update_process_times+0x2c/0x58 [80002.249047] [<ffff00000811b2c0>] tick_sched_handle.isra.5+0x30/0x48 [80002.249052] [<ffff00000811b318>] tick_sched_timer+0x40/0x90 [80002.249057] [<ffff00000810c2f4>] __hrtimer_run_queues+0xec/0x168 [80002.249062] [<ffff00000810c570>] hrtimer_interrupt+0xa0/0x228 [80002.249069] [<ffff0000087d3d48>] arch_timer_handler_phys+0x28/0x40 [80002.249074] [<ffff0000080fbe18>] handle_percpu_devid_irq+0x80/0x138 [80002.249080] [<ffff0000080f623c>] generic_handle_irq+0x24/0x38 [80002.249084] [<ffff0000080f68ec>] __handle_domain_irq+0x5c/0xb0 [80002.249088] [<ffff000008080df8>] gic_handle_irq+0x58/0xa8
-
17 minutes ago, TonyMac32 said:
As far as HC1/XU4 is concerned, my only shutdowns occur for update maintenance. I've had 60+ day uptimes running as a file and media server transcoding videos and TVHeadend DVR.
If we are talking about uptime, 60+ is not too bad (with ubuntu), so let it be with HC1.
But i do prefer something kinda
# uptime 00:38:34 up 1368 days, 5:20, 1 user, load average: 0,11, 0,09, 0,09even with cost of "lack of maintenance" if security allows that.
-
1 hour ago, chwe said:
Just read the first post of the provided thread to understand what is meant by voltage drop through connectors. A barrel plug is for sure better than a microUSB but it doesn't mean that there's no voltage drop... So the points where you measure voltage doesn't tell you much about voltage which 'arrives' at your SBC/USB...
100% agreed, nothing to argue with; @tkaiser even purposed to mesaure voltage via GPIO ... but i don't have enough internal motivation to perform tests once again + i definitely need to "define the correct questions/hypothesises" + "determine correct methods to find the proves/discards for those questions/hypothesises" ... yak! too much work for such "question": it's much easier to buy "reference PSU"
1 hour ago, chwe said:'prove us that your PSU/SD-Card (the other evergreen) setup is proper' approach.
That's a good approach when you have to make big deal with lack of resources/small team. See nothing unusual with it, even more, i was really astonished with a lots of posts of @tkaiser one-by-one in this thread.
Separately: @tkaiser, thank you for participation, i really appreciate that. BTW: does Armbian project need good photos of OPi Prime PCB ? (you've mentioned it in one of your replies) I can make it, but with my radiators in near day, or without them after my Odroid HC-1 will arrive.
1 hour ago, chwe said:A PSU which gets veeeeery hot @5V max 3A would be a one which I would throw in the bin
Looks like it will go there, as @TonyMac32 had adviced before: it's really too hot to use it without extreme caution.
1 hour ago, chwe said:Have fun with it.
")
Oh, please, no more fun like that!
Better wish me something kinda "Stable powering and smooth working" 
-
So, something like conclusion:
1. You should never use Y-USB cable for powering USB-HDD: it could cause dangerous side-effects like powering your board (and you will not even know about it);
2. Real reason for MULTIPLE "translation fault" and "usb device reset" is still unknown to me: i used two different PSUs and got errors with both, but real experiments (voltage measurement under stress) was with only one, and, finally stabilized the behavior (the reason found was Y-USB powering for HDD, but what were the reasons for all the previous crashes ? ...)
3. By "sum of facts" i could suppose 2 things:
- There is an overheat of SoC in "electric closet" which causes strange effects (weakly confirmed, need more different experiments to prove/discard)
- PSU "lied on back during tests" (this is "normal position") while in "near by electric closet" it "lied on left-side/hanged on wires" (... yeah, i know it sounds insanely, but who knows whats happening with "hot airflow" within this veeeeery hot PSU when it "lies on left-side" and there is no free airflow to the outside)
+funniest thing: never thought that board could be powered via USB, always thought that there is a "current in-flow protection from outside" (kinda "something diod-based"), but looks like "it depends on PCB-implementation" and for Orange PiPrime answer is "yes, you can continue to power the board via USB if you already powered it up"
-
23 minutes ago, tkaiser said:
The only reason I posted in this thread was since I couldn't believe what was happening and that others created the impression your powering problems would be related to software in general or Armbian.
@tkaiser so, in fact, by using (if generalize widely) "cheating methods" i got a lot of support from you using your "feeling of responsibility for the Armbian project".Do no offend please, that definitely was not my intention (i would performed all those tests anyway because of my nature, but it was good experience: to ask for help and to share results with others + learn a couple of lessons kinda "never use Y-USB" and "Check the PSU before you going to replace it")
And i think i will replace my OPi Prime with Odroid HC1 (which i hope won't be so problematic)
-
10 minutes ago, tkaiser said:
Please add spoiler tags to the walls of text you posted
Walls are spoiled, except the last one (i'll spoil it after completion).
-
35 minutes ago, tkaiser said:
- you power your board totally differently now (or did your self-built cable always looked like this with ability to connect the Multimeter)
@tkaiser Mmm.. cant understand this; as i understand "almost nothing" had changed. Do you remember this:
QuotePSU screw terminal <=> two thick wires taken from "standard black computer PSU power connector internals" <=> twist, covered with insulating tape <=> two a bit thiner (but thick enough) wires ended with 1.7mm jack (cut from 3A PSU).
Now it's just a:
PSU screw terminal <=> two thick wires taken from "standard black computer PSU power connector internals" <=> twist, covered with insulating tape + multimeter connected to this point <=> two a bit thiner (but thick enough) wires ended with 1.7mm jack (cut from 3A PSU).
So, there is only one thing changed: i removed separate power supply via Y-USB-CABLE
@tkaiser i've attached another foto, wires connection is pretty clear from it
-
6 minutes ago, tkaiser said:
I haven't checked schematics but 5V should be available on pins 4 and 6 of the GPIO header.
STEP3 candidate. After a while, and, of course, STEP2 completion.
-
52 minutes ago, chwe said:
saved 2-5$ with a shitty PSU.
It was not about "savings", i looked something different from "standard black cubes" with 5V/3A, and found that one. They have a wide range of PSU's so i thougt that they know what the do.
53 minutes ago, chwe said:magic...

In fact, indeed: for example, should not there be any protection on board from such current flow ? +there was a recommendation from other user ( @guidol ) to use separate power source for USB-HDD, so this is definitely "not obvious" (at least for me and him)
57 minutes ago, chwe said:Odroid HC1
Already ordered one from Germany with 4A PSU. There is no official shipment to Russia, but there are a lot of ways to get it.
59 minutes ago, chwe said:- Throw away the shitty PSU
Right after STEP2 (see my updates). And looks like (at least for now, after 1h:10m of testing) the problem is not with PSU (the question is "how long shoud it run in critical mode to we make sure that it is stable enough")
1 hour ago, chwe said:- Check if the voltage doesn't drop much when the disk spins up with this PSU
Disk drive is SSD, so no spinning.
1 hour ago, chwe said:- Maybe the hardest part: forget all your 'findings' until yet. They were found with a 'not proper' set up which means they might or might not count on a proper setup. As long as you're not an 'experienced' user you can't distinguish between 'useful information' and 'garbage' until yet.
Sounds strange: you deny lessons learned from negative experience. What is 'proper' or 'not proper' ? Saying 'not proper' you're making a lot of non-proved assumptions (for example about PSU). And about 'expirienced' users: once again, what will you and @tkaiser and @TonyMac32 would say if this "shitty psu" will remain stable in next 24 hours under stressed mode ? The question should be set in different form: "do we have enough proves of our assumption" but not in form "my expirience tells me that problem is with PSU, so, because i'm well-expirienced, trust me, you're wasting your time".
-
PART2
This time i used USB 3.0 "single" cable and connected multimeter to the place of twist of wires from screw terminal & 1.7mm jack (you could see all the construction on photo, i've moved all the parts from electric closet to the table, this allows to monitor voltage continuously) I've skipped tests @1104 MHz (see no point), so:
1. No load / 1152Mhz: 5.11v (funny, looks like limited electric closet space without normal airflow gives ~ +10 deg. celcius of SoC temp on idle)
SpoilerTime CPU load %cpu %sys %usr %nice %io %irq CPU C.St. 10:02:27: 1152MHz 0.08 0% 0% 0% 0% 0% 0% 20.4°C 0/8 10:02:32: 1152MHz 0.08 0% 0% 0% 0% 0% 0% 18.5°C 0/8 10:02:37: 1152MHz 0.07 0% 0% 0% 0% 0% 0% 20.2°C 0/8 10:02:42: 1152MHz 0.06 0% 0% 0% 0% 0% 0% 18.4°C 0/8 10:02:47: 1152MHz 0.06 0% 0% 0% 0% 0% 0% 18.1°C 0/8 10:02:52: 1152MHz 0.05 0% 0% 0% 0% 0% 0% 18.0°C 0/8 10:02:57: 1152MHz 0.05 0% 0% 0% 0% 0% 0% 21.2°C 0/8 10:03:03: 1152MHz 0.04 0% 0% 0% 0% 0% 0% 18.1°C 0/8 10:03:08: 1152MHz 0.04 0% 0% 0% 0% 0% 0% 20.4°C 0/8 10:03:13: 1152MHz 0.04 0% 0% 0% 0% 0% 0% 19.8°C 0/8 10:03:18: 1152MHz 0.03 0% 0% 0% 0% 0% 0% 21.2°C 0/8 10:03:23: 1152MHz 0.03 0% 0% 0% 0% 0% 0% 20.1°C 0/82. 1 minute after start a lot of IO/CPU intensive tasks: flapping 5.08..5.10V
3. 10 minutes after start a lot of IO/CPU intensive tasks: flapping 5.08..5.10V (i'm really impressed with temperature: max is 35 deg, average is ~30; defenitely electric closet was a bad idea to place the board into)
4. 20 minutes after start a lot of IO/CPU intensive tasks: still flapping 5.08..5.10V (temperature is still awesome ~28, but PSU became really hot)
5. 30 minutes after start a lot of IO/CPU intensive tasks: still flapping 5.08..5.10V (temperature is ~28, PSU is still really hot)
6. 40 minutes after start a lot of IO/CPU intensive tasks: still flapping 5.08..5.10V (temperature is ~30, PSU is still really hot; looks like i should wait PSU to overheat and shot start behave itself unpredictably)
7. 50 minutes after start a lot of IO/CPU intensive tasks: still flapping 5.08..5.10V (temperature is ~30, PSU is still really hot)
8. 2h40m after run ... and nothing happened: 5.09 is stable now, temperature is stable ~30.
Spoiler10:05:25: 1152MHz 0.02 0% 0% 0% 0% 0% 0% 18.6°C 0/8 10:05:30: 1152MHz 0.02 0% 0% 0% 0% 0% 0% 20.3°C 0/8 10:05:35: 1152MHz 0.01 0% 0% 0% 0% 0% 0% 19.7°C 0/8 10:05:40: 1152MHz 0.01 0% 0% 0% 0% 0% 0% 17.3°C 0/8 10:05:45: 1152MHz 0.01 0% 0% 0% 0% 0% 0% 19.1°C 0/8 10:05:50: 1152MHz 0.01 1% 1% 0% 0% 0% 0% 23.0°C 0/8 10:05:55: 1152MHz 0.09 6% 1% 2% 0% 3% 0% 22.3°C 0/8 10:06:00: 1152MHz 0.24 34% 6% 21% 0% 6% 0% 23.8°C 0/8 10:06:05: 1152MHz 0.46 56% 3% 41% 0% 11% 0% 29.2°C 0/8 Time CPU load %cpu %sys %usr %nice %io %irq CPU C.St. 10:06:10: 1152MHz 0.51 40% 2% 32% 0% 4% 0% 24.9°C 0/8 10:06:15: 1152MHz 0.63 42% 1% 39% 0% 1% 0% 31.0°C 0/8 10:06:20: 1152MHz 0.82 55% 5% 44% 0% 5% 1% 28.9°C 0/8 10:06:26: 1152MHz 0.99 53% 4% 43% 0% 4% 0% 28.2°C 0/8 10:06:31: 1152MHz 1.07 65% 3% 61% 0% 0% 1% 32.4°C 0/8 10:06:36: 1152MHz 1.15 67% 6% 38% 0% 21% 0% 29.9°C 0/8 10:06:41: 1152MHz 1.30 73% 6% 36% 0% 28% 1% 30.4°C 0/8 10:06:46: 1152MHz 2.23 80% 14% 17% 0% 47% 0% 26.6°C 0/8 10:06:51: 1152MHz 2.94 74% 8% 17% 0% 47% 1% 28.8°C 0/8 10:06:56: 1152MHz 3.90 82% 7% 29% 0% 45% 1% 27.5°C 0/8 10:07:01: 1152MHz 5.11 88% 14% 27% 0% 45% 1% 31.5°C 0/8 10:07:06: 1152MHz 5.82 82% 9% 27% 0% 44% 1% 25.5°C 0/8 ... 10 minutes after run ... 10:16:19: 1152MHz 7.98 96% 9% 58% 0% 27% 1% 34.5°C 0/8 Time CPU load %cpu %sys %usr %nice %io %irq CPU C.St. 10:16:24: 1152MHz 8.30 99% 9% 54% 0% 33% 1% 35.7°C 0/8 10:16:29: 1152MHz 8.84 97% 7% 41% 0% 47% 1% 31.2°C 0/8 10:16:34: 1152MHz 9.25 100% 4% 44% 0% 48% 1% 31.2°C 0/8 10:16:39: 1152MHz 9.15 96% 5% 35% 0% 52% 2% 31.3°C 0/8 10:16:45: 1152MHz 8.98 75% 5% 12% 0% 57% 0% 27.3°C 0/8 10:16:50: 1152MHz 8.74 78% 6% 12% 0% 58% 0% 25.2°C 0/8 10:16:55: 1152MHz 8.84 75% 6% 18% 0% 48% 0% 29.4°C 0/8 10:17:00: 1152MHz 9.65 86% 6% 13% 0% 66% 0% 27.8°C 0/8 10:17:05: 1152MHz 10.16 99% 7% 18% 0% 72% 0% 30.0°C 0/8 10:17:10: 1152MHz 10.15 97% 6% 16% 0% 73% 1% 29.0°C 0/8 10:17:15: 1152MHz 10.62 99% 10% 16% 0% 71% 0% 28.9°C 0/8 10:17:20: 1152MHz 10.49 94% 6% 3% 0% 83% 0% 25.9°C 0/8 ... 20 minutes after run ... Time CPU load %cpu %sys %usr %nice %io %irq CPU C.St. 10:26:39: 1152MHz 8.59 92% 9% 28% 0% 53% 0% 30.1°C 0/8 10:26:45: 1152MHz 8.86 97% 8% 44% 0% 42% 1% 31.0°C 0/8 10:26:50: 1152MHz 8.95 99% 7% 34% 0% 56% 0% 32.1°C 0/8 10:26:55: 1152MHz 9.04 100% 3% 30% 0% 64% 0% 28.7°C 0/8 10:27:00: 1152MHz 8.96 100% 4% 36% 0% 58% 0% 29.4°C 0/8 10:27:05: 1152MHz 8.88 94% 5% 22% 0% 65% 0% 26.7°C 0/8 10:27:10: 1152MHz 8.73 92% 6% 22% 0% 62% 0% 27.7°C 0/8 10:27:15: 1152MHz 8.75 86% 6% 14% 0% 64% 0% 29.3°C 0/8 10:27:20: 1152MHz 8.37 90% 9% 40% 0% 40% 1% 33.6°C 0/8 10:27:25: 1152MHz 8.42 94% 7% 14% 0% 71% 0% 28.3°C 0/8 ... 30 minutes after run ... 10:36:51: 1152MHz 9.75 89% 6% 36% 0% 45% 0% 30.7°C 0/8 10:36:56: 1152MHz 9.61 98% 6% 48% 0% 43% 0% 33.9°C 0/8 10:37:01: 1152MHz 9.56 96% 8% 48% 0% 38% 1% 28.2°C 0/8 10:37:07: 1152MHz 9.36 94% 8% 42% 0% 43% 0% 29.8°C 0/8 10:37:12: 1152MHz 9.33 90% 6% 40% 0% 43% 0% 29.8°C 0/8 10:37:17: 1152MHz 8.98 82% 7% 19% 0% 54% 0% 27.2°C 0/8 ... 40 minutes after run ... Time CPU load %cpu %sys %usr %nice %io %irq CPU C.St. 10:47:04: 1152MHz 9.29 96% 9% 47% 0% 37% 1% 32.2°C 0/8 10:47:09: 1152MHz 9.34 95% 9% 40% 0% 44% 1% 30.0°C 0/8 10:47:14: 1152MHz 9.56 88% 5% 9% 0% 72% 0% 25.7°C 0/8 10:47:19: 1152MHz 9.27 87% 5% 15% 0% 65% 0% 25.7°C 0/8 10:47:24: 1152MHz 9.01 88% 6% 17% 0% 63% 0% 26.4°C 0/8 10:47:29: 1152MHz 8.69 90% 10% 39% 0% 40% 0% 31.7°C 0/8 10:47:35: 1152MHz 8.79 99% 6% 49% 0% 41% 1% 32.1°C 0/8 10:47:40: 1152MHz 8.89 94% 8% 44% 0% 41% 0% 34.2°C 0/8 10:47:45: 1152MHz 8.74 93% 7% 33% 0% 50% 0% 29.2°C 0/8 10:47:50: 1152MHz 8.68 91% 7% 18% 0% 65% 0% 30.2°C 0/8 ... 50 minutes after run ... 10:56:31: 1152MHz 9.27 96% 8% 32% 0% 54% 1% 27.3°C 0/8 10:56:36: 1152MHz 9.69 96% 8% 55% 0% 30% 1% 33.4°C 0/8 10:56:41: 1152MHz 9.64 98% 7% 49% 0% 40% 1% 30.5°C 0/8 10:56:46: 1152MHz 9.35 98% 9% 49% 0% 38% 1% 30.9°C 0/8 10:56:51: 1152MHz 9.32 96% 9% 43% 0% 43% 1% 31.0°C 0/8 10:56:56: 1152MHz 9.37 90% 6% 38% 0% 43% 1% 29.9°C 0/8 10:57:01: 1152MHz 9.50 93% 8% 44% 0% 39% 1% 30.7°C 0/8 10:57:06: 1152MHz 9.86 97% 5% 36% 0% 54% 0% 28.4°C 0/8 10:57:12: 1152MHz 10.04 97% 5% 24% 0% 67% 0% 28.3°C 0/8 ... 2h40m after run... Time CPU load %cpu %sys %usr %nice %io %irq CPU C.St. 12:46:19: 1152MHz 8.53 87% 6% 46% 0% 33% 1% 32.3°C 0/8 12:46:24: 1152MHz 8.17 82% 6% 35% 0% 39% 1% 27.7°C 0/8 12:46:29: 1152MHz 7.84 78% 4% 27% 0% 44% 0% 28.4°C 0/8 12:46:34: 1152MHz 7.53 79% 4% 34% 0% 39% 1% 28.6°C 0/8 12:46:39: 1152MHz 7.33 83% 6% 43% 0% 31% 2% 29.2°C 0/8 12:46:44: 1152MHz 7.06 75% 5% 32% 0% 37% 0% 28.7°C 0/8 12:46:49: 1152MHz 6.73 58% 6% 7% 0% 44% 0% 27.1°C 0/8 12:46:54: 1152MHz 6.67 62% 4% 7% 0% 49% 0% 24.1°C 0/8 12:47:00: 1152MHz 6.94 84% 6% 44% 0% 31% 1% 28.8°C 0/8 12:47:05: 1152MHz 6.95 85% 5% 41% 0% 36% 1% 27.7°C 0/8 12:47:10: 1152MHz 6.79 80% 6% 37% 0% 35% 1% 27.1°C 0/8 12:47:15: 1152MHz 6.65 86% 13% 30% 0% 40% 1% 27.8°C 0/8 12:47:20: 1152MHz 7.56 90% 13% 47% 0% 28% 1% 29.4°C 0/8 12:47:25: 1152MHz 7.99 83% 6% 33% 0% 41% 1% 29.4°C 0/8 12:47:30: 1152MHz 8.47 83% 6% 38% 0% 37% 0% 29.5°C 0/8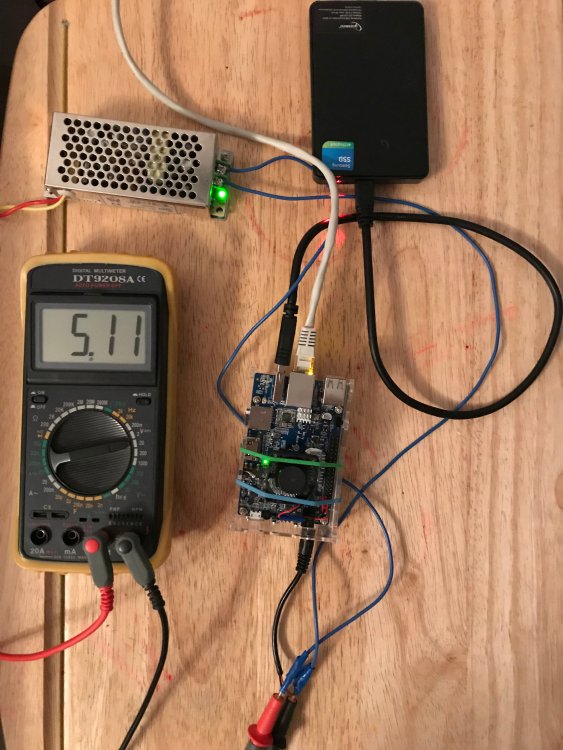
-
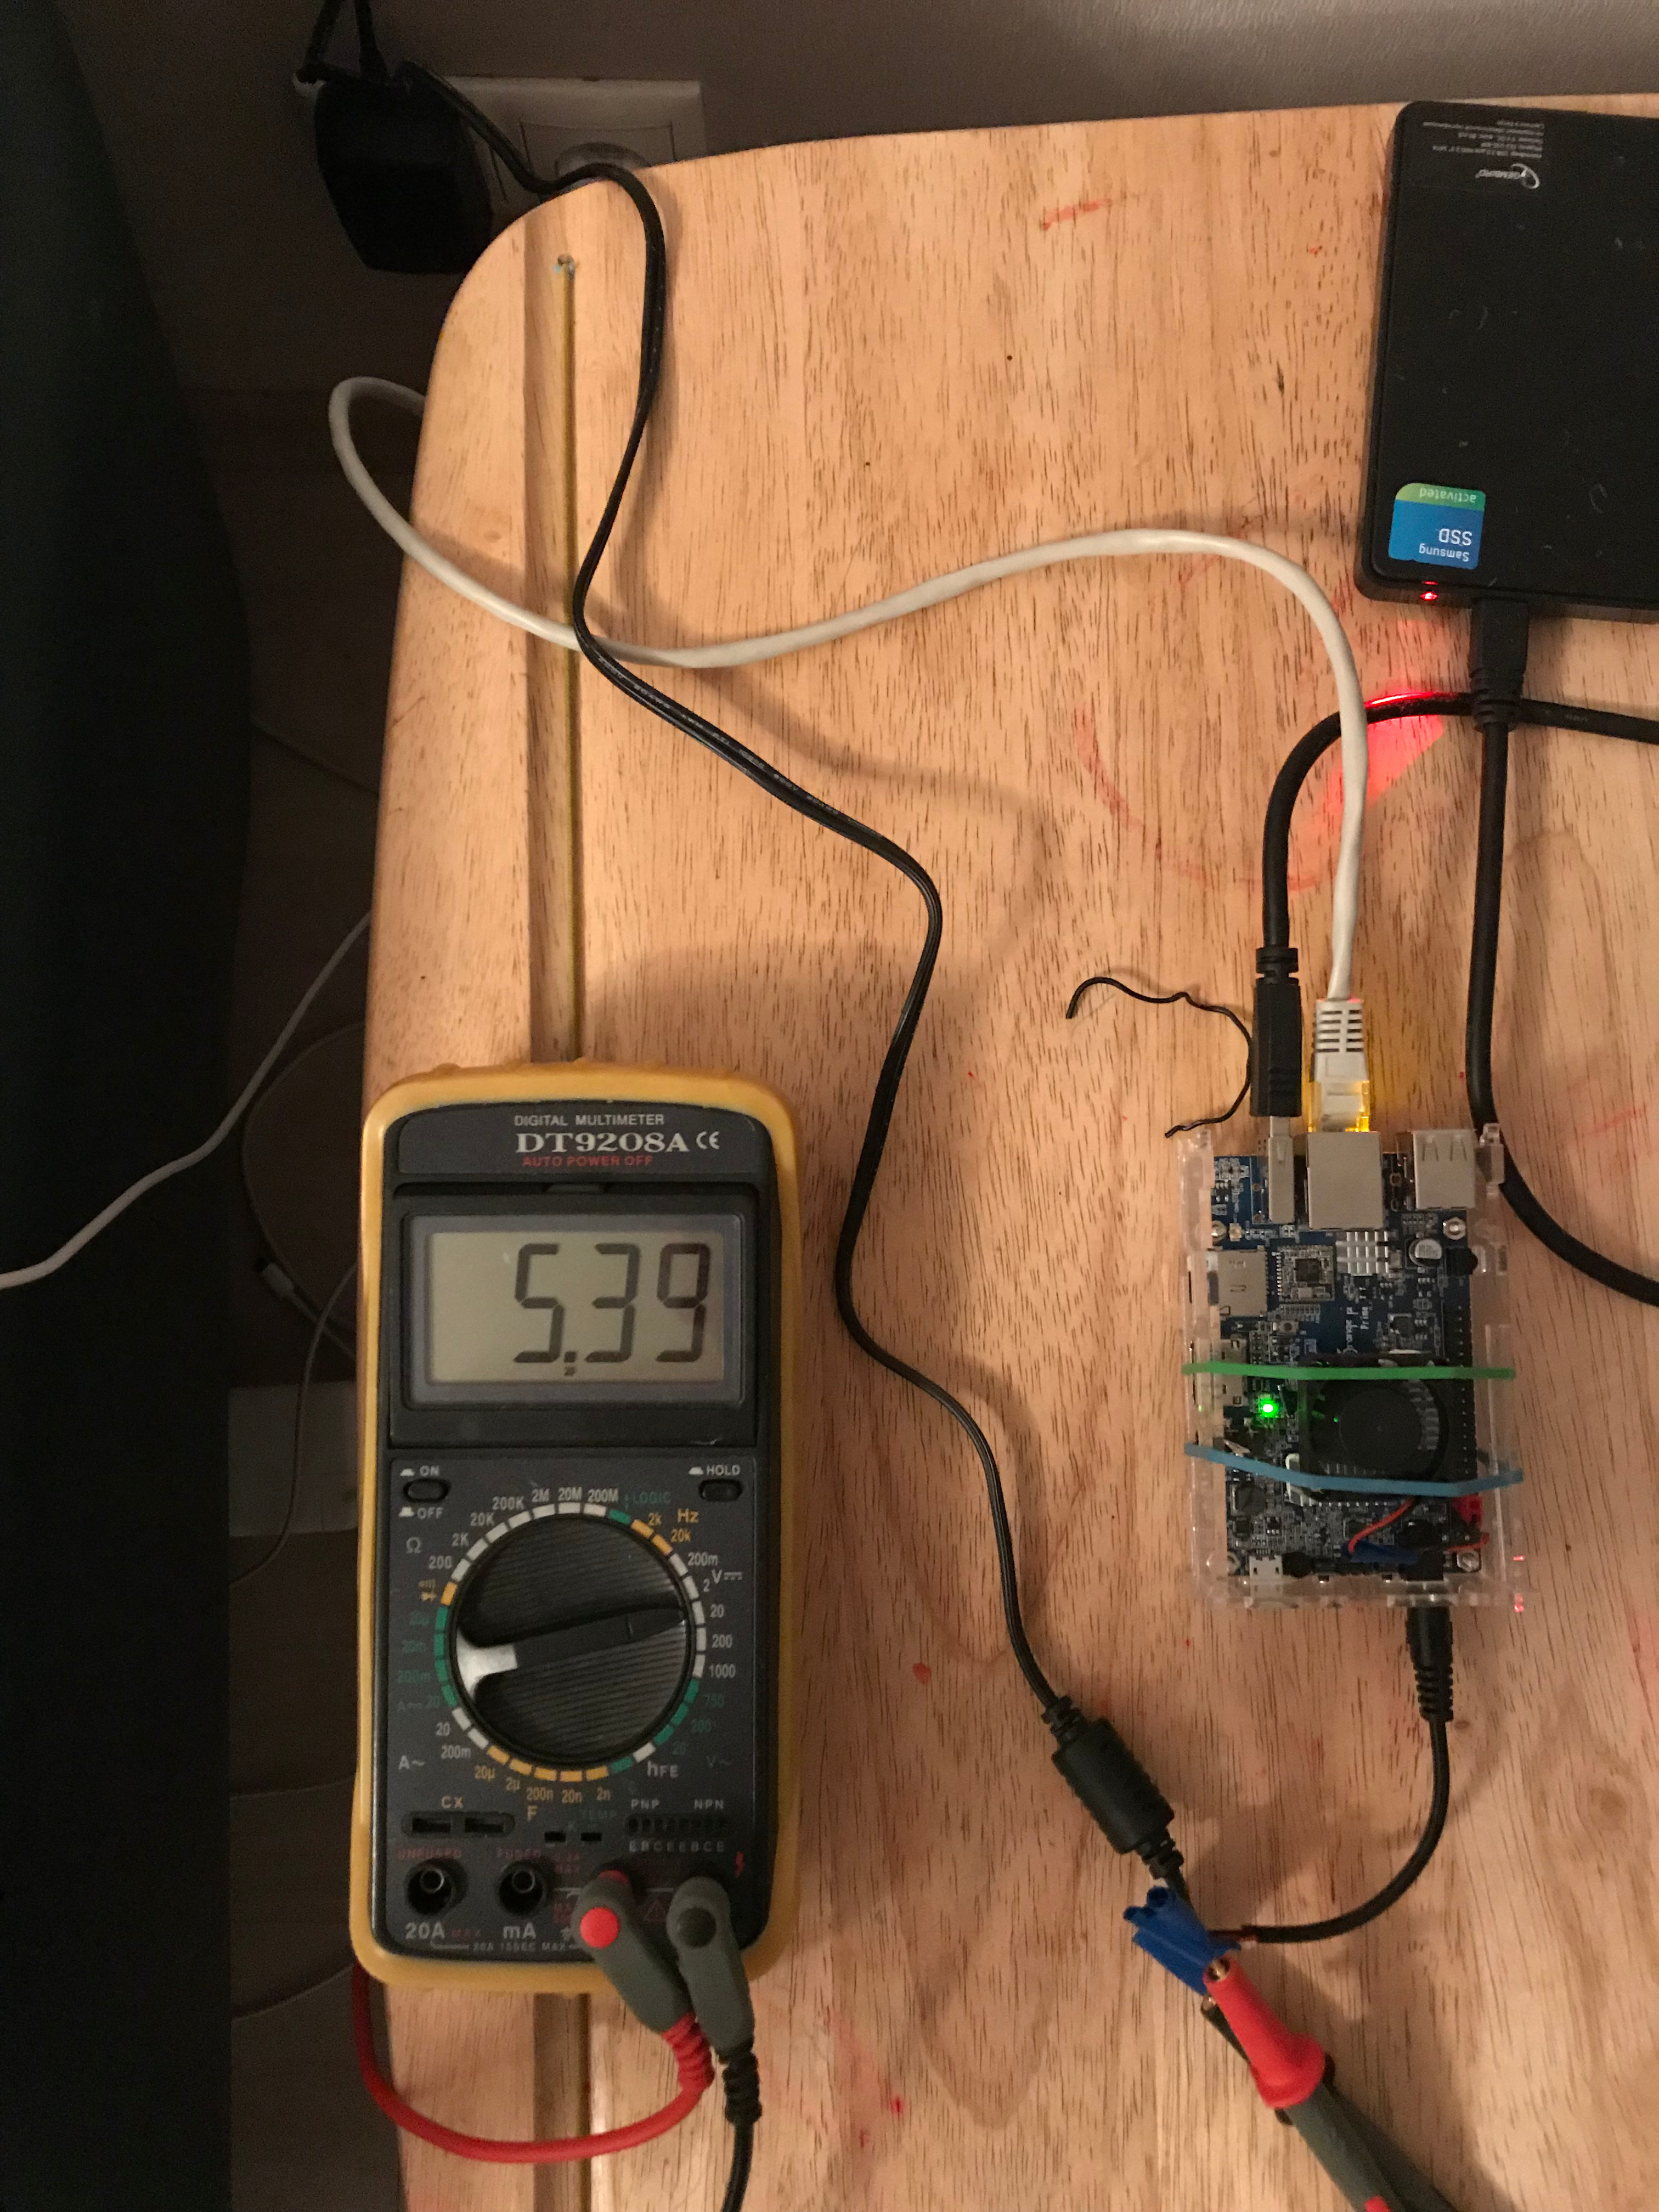
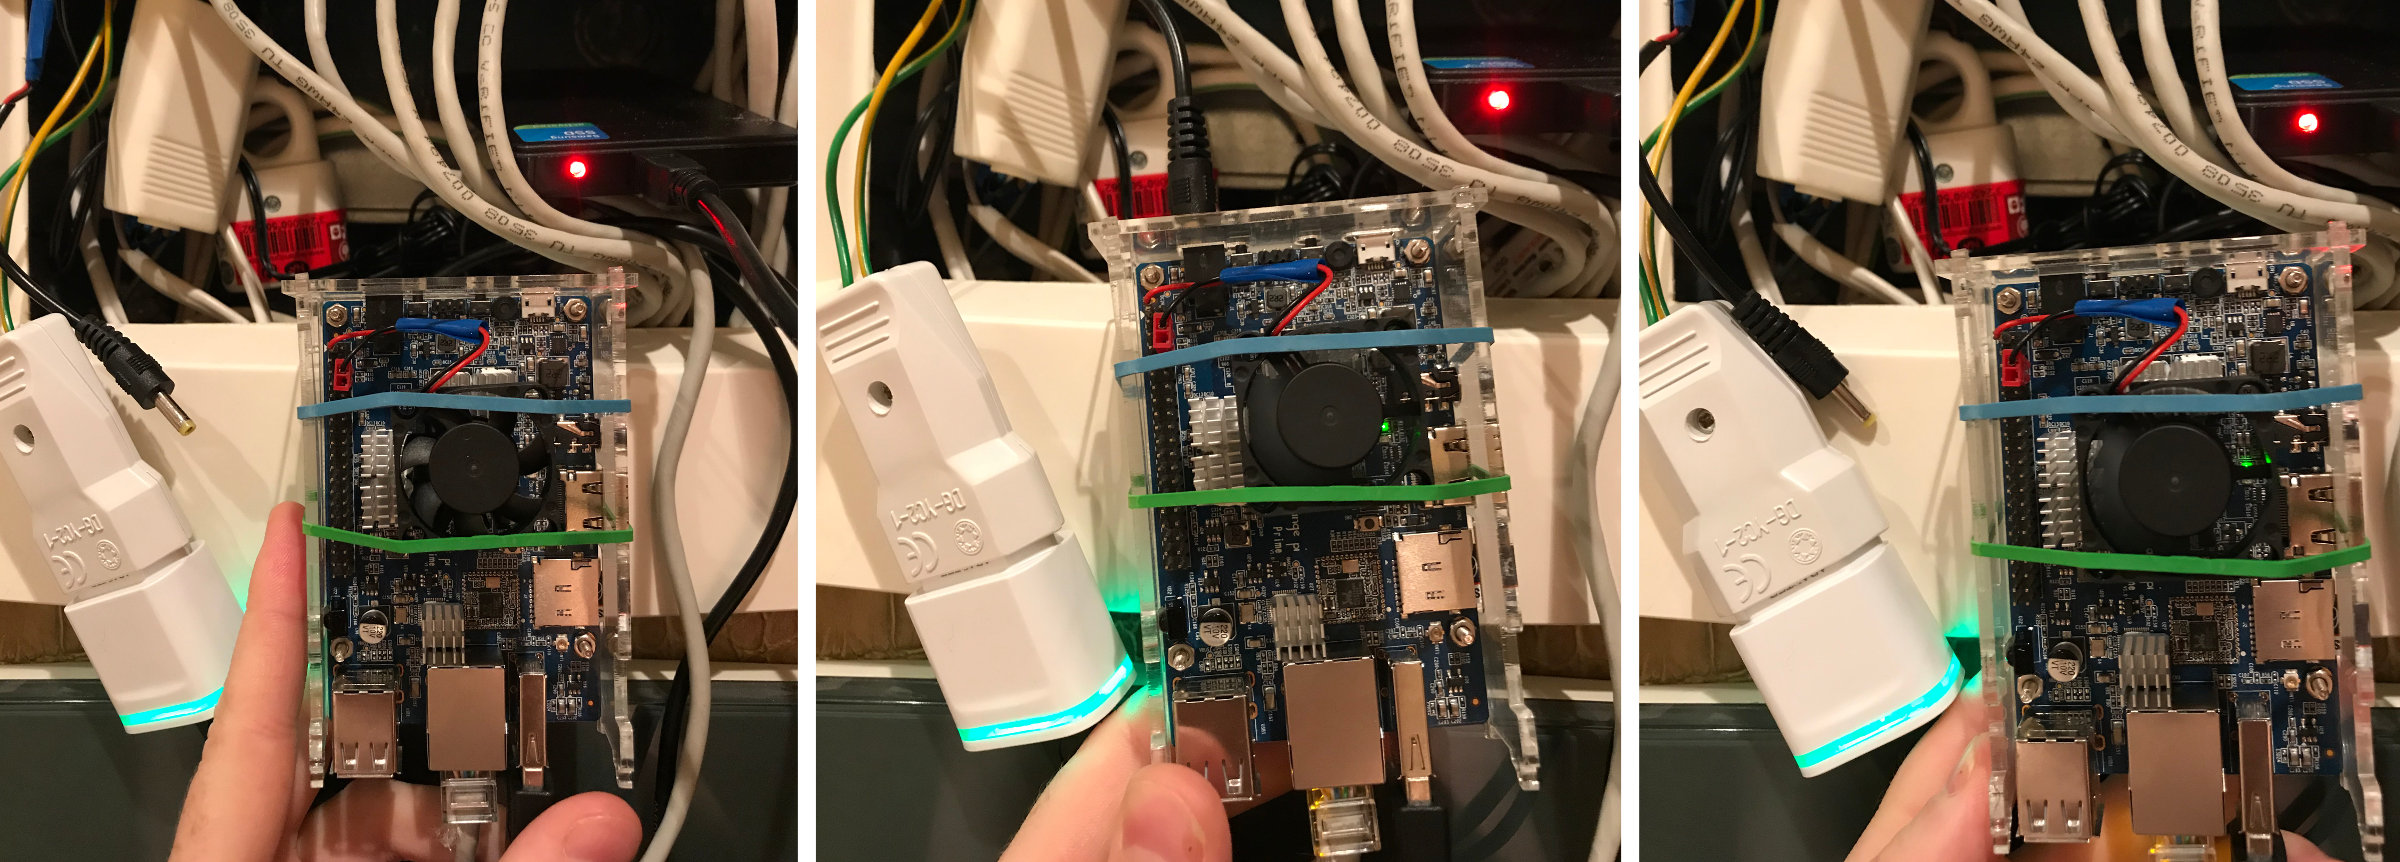
Daamn .... unplugged the 1.7mm-jacked cable to make PART2-experiment with "standard cube psu", got cable in my hand and shocked ... THE SYSTEM IS STILL ONLINE (fan is working, network led is blinking)! All the time it had some kind of DOUBLE-powering (USB charger via Y-USB-CABLE + 1.7mm jack from PSU). How is that possible at all ?
@tkaiser you was right, if the Y-USB-cabling is prohibited by USB specification than that is because of "fear of side electrical effects" that partially described in https://superuser.com/a/1022965
@guidol that's a lesson for both of us: i think starting from this day you definitely should not recommend to use Y-USB-CABLE (i.e. separate power for USB) to anyone, side-effects are absolutely unpredictable
 Take a look at the photo attached:
- left one: HDD is powered via Y-USB-cable, 1.7mm jack is out, board is not powered
- in the middle: both 1.7mm & Y-USB-cable attached, board is powered on
- right one: 1.7mm jack is out, but the board is still powered on, i.e. "powering the board through Y-USB-CABLE"
Looks like PART1 needs to be revised with "normal USB cable" and the same PSU.

-
@TonyMac32 you know, the problem is that the first time i used another 5V/3A PSU ("standard black cube") but got the same symptoms multiple times ("usb device reset" and "translation fault"). Looks like it's time for PART2 with "black cube" .. (but in fact, this "dance with dragons" is a bit annoying: i just want it to work, but absolutely do not want to fight against "the army of undead boards and PSUs")

-
PART1 (hope a will have enough patience to write other parts)
HDD has additional "power" connection to USB-charger (via Y-USB-cable)
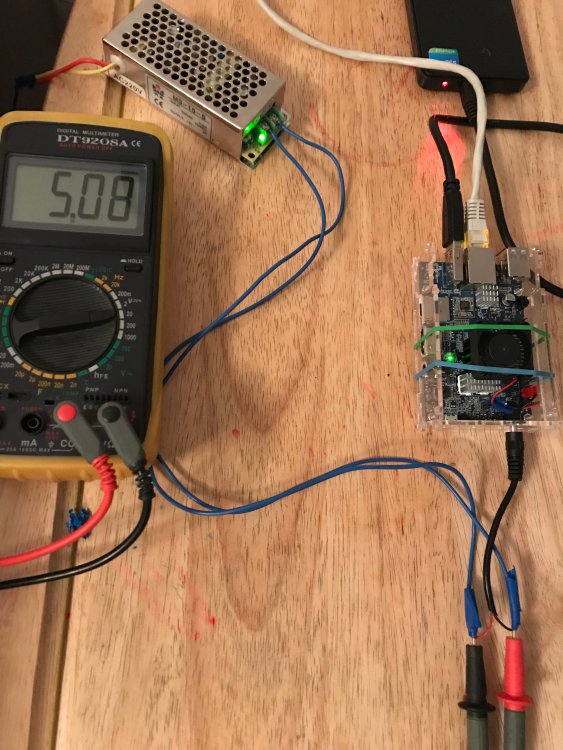
All measurements made on screw terminals of PSU with multimeter (image attached)
TL;DR: PSU becomes unstable after a while on heavy load scenarios according to measurement on screw terminals: after 40 minutes of work voltage jumps to 20V, i.e. we have OVERVOLTAGE and after that "translation fault" and "USB device reset" ( http://sprunge.us/FKMO )
remark: i can't measure "all the time", because the PSU and board are located inside(board) and outside (PSU) "electric closet", so i had to "run to PSU, measure, and run back to computer".
@tkaiser @Igor @zador.blood.stained @guidol have you ever seen something like that ?
1. Default, no load: 5.14V
2. 10 min after 1104MHz: 5.17V
3. 20 min after 1104Mhz: 5.15V
Spoiler17:46:55: 1104MHz 6.07 17% 2% 9% 0% 5% 0% 39.2°C 0/8 17:47:00: 1104MHz 5.83 77% 18% 27% 0% 29% 1% 37.8°C 0/8 ... 10 minutes after ... Time CPU load %cpu %sys %usr %nice %io %irq CPU C.St. 17:57:01: 1104MHz 3.71 86% 11% 42% 0% 31% 1% 39.4°C 0/8 17:57:06: 1104MHz 3.66 77% 8% 46% 0% 19% 2% 40.2°C 0/8 17:57:11: 1104MHz 4.16 82% 19% 45% 0% 15% 1% 43.1°C 0/8 17:57:16: 1104MHz 4.15 77% 10% 51% 0% 14% 1% 40.9°C 0/8 ... 20 minuter after ... 18:06:51: 1104MHz 4.03 72% 8% 51% 0% 10% 1% 42.7°C 0/8 18:06:56: 1104MHz 3.95 70% 7% 52% 0% 8% 0% 42.4°C 0/8 18:07:01: 1104MHz 3.87 69% 7% 54% 0% 6% 0% 41.9°C 0/8 18:07:07: 1104MHz 3.80 69% 8% 53% 0% 7% 0% 41.9°C 0/84. After stop all the processes for a couple of minutes / 1104MHz: 5.14V
SpoilerTime CPU load %cpu %sys %usr %nice %io %irq CPU C.St. 18:09:46: 1104MHz 0.93 18% 2% 9% 0% 5% 0% 32.3°C 0/8 18:09:51: 1104MHz 0.85 0% 0% 0% 0% 0% 0% 31.8°C 0/8 18:09:56: 1104MHz 0.78 0% 0% 0% 0% 0% 0% 31.2°C 0/8 18:10:01: 1104MHz 0.72 0% 0% 0% 0% 0% 0% 32.8°C 0/8 18:10:06: 1104MHz 0.66 0% 0% 0% 0% 0% 0% 31.8°C 0/85. "Uncontrollable hell begin": Lots of IO and CPU-heavy processes (but CPU-overload causes drops in IO) @1152 MHz: 5.12V
6. 10 min after "Uncontrollable hell begin" @1152MHz: 5.12V
7. 20 min after "Uncontrollable hell begin" @1152MHz: Flapping 5.11..5.12V (measurement took ~ 40 sec)
8. 30 min after "Uncontrollable hell begin" @1152MHz: Still flapping 5.11..5.12V (measurement took ~ 1 minute)
9. 40 min after "Uncontrollable hell begin" @1152MHz: INSANITY 6.2..8.7V (measurement took ~ 30 sec)
10. 42 min after "Uncontrollable hell begin" @1152MHz: ABSOLUTE MADNESS 16.1..19.7V (measurement took ~ 30 sec)
11. 45 min after "Uncontrollable hell begin" @1152MHz: LOWERING 12.1..12.5V (measurement took ~ 30 sec)
12. ~50 min afer "Uncontrollable hell begin" @1152 MHZ: 5.13V and everything is dead: http://sprunge.us/FKMO
SpoilerTime CPU load %cpu %sys %usr %nice %io %irq CPU C.St. 18:14:25: 1152MHz 4.98 18% 2% 9% 0% 5% 0% 46.6°C 0/8 18:14:30: 1152MHz 5.38 99% 15% 80% 0% 0% 4% 44.8°C 0/8 18:14:35: 1152MHz 6.07 99% 7% 77% 0% 11% 2% 44.4°C 0/8 18:14:41: 1152MHz 6.31 81% 5% 38% 0% 36% 1% 37.5°C 0/8 18:14:46: 1152MHz 7.40 99% 20% 74% 0% 0% 4% 43.9°C 0/8 18:14:51: 1152MHz 8.65 94% 15% 63% 0% 13% 2% 41.7°C 0/8 ... 10 minutes after ... Time CPU load %cpu %sys %usr %nice %io %irq CPU C.St. 18:23:29: 1152MHz 9.90 93% 7% 51% 0% 32% 1% 43.1°C 0/8 18:23:34: 1152MHz 9.99 99% 9% 84% 0% 2% 2% 47.2°C 0/8 18:23:39: 1152MHz 10.63 100% 12% 84% 0% 0% 3% 46.0°C 0/8 18:23:45: 1152MHz 10.74 80% 8% 48% 0% 23% 1% 41.4°C 0/8 18:23:50: 1152MHz 10.44 81% 10% 39% 0% 30% 1% 42.5°C 0/8 18:23:55: 1152MHz 10.09 90% 7% 34% 0% 47% 1% 41.4°C 0/8 18:24:00: 1152MHz 10.16 93% 5% 21% 0% 65% 0% 36.2°C 0/8 18:24:05: 1152MHz 9.91 97% 5% 49% 0% 41% 1% 43.1°C 0/8 18:24:10: 1152MHz 9.67 87% 6% 47% 0% 32% 1% 41.9°C 0/8 18:24:15: 1152MHz 9.62 87% 6% 29% 0% 50% 1% 39.4°C 0/8 18:24:20: 1152MHz 9.41 88% 5% 32% 0% 48% 1% 40.4°C 0/8 18:24:26: 1152MHz 9.30 81% 5% 30% 0% 44% 1% 38.8°C 0/8 18:24:31: 1152MHz 9.11 81% 6% 30% 0% 44% 1% 38.7°C 0/8 18:24:36: 1152MHz 8.94 84% 6% 36% 0% 38% 2% 43.9°C 0/8 ... 20 minutes after ... Time CPU load %cpu %sys %usr %nice %io %irq CPU C.St. 18:33:44: 1152MHz 8.74 92% 3% 27% 0% 60% 0% 38.6°C 0/8 18:33:49: 1152MHz 8.68 94% 3% 30% 0% 58% 1% 38.5°C 0/8 18:33:54: 1152MHz 8.79 89% 5% 31% 0% 51% 1% 40.4°C 0/8 18:33:59: 1152MHz 10.65 98% 9% 72% 0% 14% 2% 45.9°C 0/8 18:34:04: 1152MHz 10.60 86% 6% 30% 0% 48% 1% 39.1°C 0/8 18:34:09: 1152MHz 10.55 83% 4% 28% 0% 49% 0% 37.4°C 0/8 18:34:15: 1152MHz 11.15 94% 13% 37% 0% 41% 2% 39.6°C 0/8 18:34:20: 1152MHz 11.38 84% 11% 28% 0% 42% 1% 38.4°C 0/8 18:34:25: 1152MHz 10.94 82% 9% 32% 0% 39% 1% 40.4°C 0/8 18:34:30: 1152MHz 10.55 90% 8% 44% 0% 35% 1% 41.7°C 0/8 18:34:35: 1152MHz 10.42 96% 6% 33% 0% 53% 1% 40.3°C 0/8 18:34:40: 1152MHz 10.55 94% 5% 59% 0% 27% 2% 43.4°C 0/8 18:34:46: 1152MHz 10.59 95% 6% 63% 0% 24% 1% 44.0°C 0/8 18:34:51: 1152MHz 11.26 99% 6% 89% 0% 0% 2% 45.9°C 0/8 18:34:56: 1152MHz 11.56 88% 8% 26% 0% 50% 1% 39.1°C 0/8 ... 30 minutes after .... Time CPU load %cpu %sys %usr %nice %io %irq CPU C.St. 18:43:35: 1152MHz 10.95 90% 5% 29% 0% 55% 0% 38.1°C 0/8 18:43:40: 1152MHz 10.79 85% 6% 30% 0% 47% 0% 38.6°C 0/8 18:43:45: 1152MHz 10.65 86% 5% 29% 0% 50% 0% 39.7°C 0/8 18:43:50: 1152MHz 10.68 93% 3% 28% 0% 59% 0% 39.0°C 0/8 18:43:55: 1152MHz 10.70 94% 9% 60% 0% 21% 1% 42.5°C 0/8 18:44:01: 1152MHz 10.32 93% 9% 46% 0% 37% 0% 42.2°C 0/8 18:44:06: 1152MHz 11.26 88% 21% 36% 0% 29% 1% 42.1°C 0/8 18:44:11: 1152MHz 11.80 90% 8% 53% 0% 25% 2% 43.1°C 0/8 18:44:16: 1152MHz 11.98 83% 7% 42% 0% 32% 1% 42.0°C 0/8 18:44:21: 1152MHz 12.22 77% 9% 29% 0% 37% 1% 35.8°C 0/8 18:44:26: 1152MHz 12.44 77% 8% 15% 0% 51% 1% 40.8°C 0/8 ... 40 minutes after ... Time CPU load %cpu %sys %usr %nice %io %irq CPU C.St. 18:52:58: 1152MHz 9.48 96% 9% 77% 0% 8% 2% 46.9°C 0/8 18:53:03: 1152MHz 9.12 98% 9% 77% 0% 9% 2% 45.6°C 0/8 18:53:08: 1152MHz 8.95 94% 15% 45% 0% 31% 2% 45.9°C 0/8 18:53:13: 1152MHz 9.28 83% 8% 31% 0% 42% 1% 39.1°C 0/8 18:53:19: 1152MHz 9.74 82% 8% 35% 0% 35% 2% 42.2°C 0/8 18:53:24: 1152MHz 9.92 94% 5% 69% 0% 16% 2% 42.8°C 0/8 18:53:29: 1152MHz 9.44 93% 9% 49% 0% 33% 1% 46.6°C 0/8 18:53:35: 1152MHz 9.57 97% 9% 71% 0% 13% 2% 46.7°C 0/8 18:53:40: 1152MHz 9.84 100% 11% 85% 0% 0% 2% 48.0°C 0/8 18:53:45: 1152MHz 10.26 94% 8% 68% 0% 16% 1% 45.3°C 0/8 18:53:50: 1152MHz 9.83 94% 9% 68% 0% 15% 1% 46.0°C 0/8 18:53:55: 1152MHz 9.41 96% 6% 54% 0% 33% 1% 45.7°C 0/8 18:54:00: 1152MHz 9.06 81% 3% 4% 0% 73% 0% 38.4°C 0/8 18:54:06: 1152MHz 9.69 91% 9% 51% 0% 28% 1% 45.9°C 0/8 18:54:11: 1152MHz 9.96 100% 8% 88% 0% 0% 2% 46.9°C 0/8 ... 42 mins after ... 18:56:54: 1152MHz 10.01 84% 6% 49% 0% 26% 1% 43.8°C 0/8 18:56:59: 1152MHz 9.61 87% 8% 45% 0% 31% 1% 43.8°C 0/8 18:57:05: 1152MHz 9.48 90% 8% 57% 0% 23% 1% 46.2°C 0/8 18:57:10: 1152MHz 9.28 93% 7% 69% 0% 14% 1% 46.1°C 0/8 18:57:15: 1152MHz 9.18 90% 8% 46% 0% 34% 1% 45.3°C 0/8 18:57:20: 1152MHz 9.08 94% 10% 47% 0% 34% 2% 45.3°C 0/8 ... 45 mins after ... Time CPU load %cpu %sys %usr %nice %io %irq CPU C.St. 18:58:13: 1152MHz 9.32 95% 8% 67% 0% 17% 1% 46.1°C 0/8 18:58:18: 1152MHz 9.05 98% 8% 82% 0% 5% 2% 44.2°C 0/8 18:58:24: 1152MHz 12.73 38% 2% 11% 0% 24% 0% 36.1°C 0/8 18:58:29: 1152MHz 16.12 25% 0% 0% 0% 24% 0% 34.4°C 0/8 18:58:34: 1152MHz 19.23 30% 0% 0% 0% 30% 0% 35.0°C 0/8 18:58:39: 1152MHz 22.18 50% 0% 0% 0% 49% 0% 36.1°C 0/8 18:58:44: 1152MHz 24.88 50% 0% 0% 0% 49% 0% 33.0°C 0/8 18:58:49: 1152MHz 27.38 50% 0% 0% 0% 49% 0% 35.1°C 0/8 18:58:54: 1152MHz 29.67 28% 2% 0% 0% 25% 0% 34.7°C 0/8 18:58:59: 1152MHz 27.29 0% 0% 0% 0% 0% 0% 34.4°C 0/8 18:59:04: 1152MHz 25.11 0% 0% 0% 0% 0% 0% 31.7°C 0/8 18:59:09: 1152MHz 23.10 0% 0% 0% 0% 0% 0% 32.9°C 0/8 18:59:14: 1152MHz 21.25 0% 0% 0% 0% 0% 0% 34.4°C 0/8 18:59:19: 1152MHz 19.54 0% 0% 0% 0% 0% 0% 34.1°C 0/8 18:59:24: 1152MHz 17.98 0% 0% 0% 0% 0% 0% 34.8°C 0/8 Time CPU load %cpu %sys %usr %nice %io %irq CPU C.St. 18:59:29: 1152MHz 16.54 0% 0% 0% 0% 0% 0% 34.0°C 0/8 18:59:35: 1152MHz 15.21 0% 0% 0% 0% 0% 0% 32.1°C 0/8 18:59:40: 1152MHz 14.00 0% 0% 0% 0% 0% 0% 32.7°C 0/8 ... dies ... 18:59:14: 1152MHz 21.25 0% 0% 0% 0% 0% 0% 34.4°C 0/8 18:59:19: 1152MHz 19.54 0% 0% 0% 0% 0% 0% 34.1°C 0/8 18:59:24: 1152MHz 17.98 0% 0% 0% 0% 0% 0% 34.8°C 0/8 Time CPU load %cpu %sys %usr %nice %io %irq CPU C.St. 18:59:29: 1152MHz 16.54 0% 0% 0% 0% 0% 0% 34.0°C 0/8 18:59:35: 1152MHz 15.21 0% 0% 0% 0% 0% 0% 32.1°C 0/8 18:59:40: 1152MHz 14.00 0% 0% 0% 0% 0% 0% 32.7°C 0/8 18:59:45: 1152MHz 12.87 0% 0% 0% 0% 0% 0% 34.5°C 0/8 18:59:50: 1152MHz 11.84 0% 0% 0% 0% 0% 0% 30.9°C 0/8 18:59:55: 1152MHz 10.89 0% 0% 0% 0% 0% 0% 31.2°C 0/8 19:00:00: 1152MHz 10.02 0% 0% 0% 0% 0% 0% 32.4°C 0/8 19:00:05: 1152MHz 9.22 0% 0% 0% 0% 0% 0% 34.1°C 0/8 19:00:10: 1152MHz 8.48 0% 0% 0% 0% 0% 0% 32.5°C 0/8 19:00:15: 1152MHz 7.80 0% 0% 0% 0% 0% 0% 33.6°C 0/8 19:00:20: 1152MHz 7.18 0% 0% 0% 0% 0% 0% 31.9°C 0/8 19:00:25: 1152MHz 6.60 0% 0% 0% 0% 0% 0% 34.8°C 0/8 19:00:30: 1152MHz 6.07 0% 0% 0% 0% 0% 0% 30.9°C 0/8 19:00:35: 1152MHz 5.59 0% 0% 0% 0% 0% 0% 31.3°C 0/8 19:00:40: 1152MHz 5.14 0% 0% 0% 0% 0% 0% 32.4°C 0/8 Time CPU load %cpu %sys %usr %nice %io %irq CPU C.St. 19:00:45: 1152MHz 4.73 0% 0% 0% 0% 0% 0% 32.5°C 0/8 19:00:51: 1152MHz 4.43 0% 0% 0% 0% 0% 0% 34.0°C 0/8 19:00:56: 1152MHz 3.75 0% 0% 0% 0% 0% 0% 31.9°C 0/8 19:01:01: 1152MHz 3.45 0% 0% 0% 0% 0% 0% 30.5°C 0/8 19:01:06: 1152MHz 3.17 0% 0% 0% 0% 0% 0% 31.5°C 0/8 19:01:11: 1152MHz 2.92 0% 0% 0% 0% 0% 0% 30.6°C 0/8 19:01:16: 1152MHz 2.68 0% 0% 0% 0% 0% 0% 32.7°C 0/8 19:01:21: 1152MHz 2.47 0% 0% 0% 0% 0% 0% 31.8°C 0/8 19:01:26: 1152MHz 2.27 0% 0% 0% 0% 0% 0% 33.6°C 0/8 19:01:31: 1152MHz 2.09 0% 0% 0% 0% 0% 0% 32.3°C 0/8 19:01:36: 1152MHz 1.92 0% 0% 0% 0% 0% 0% 32.4°C 0/8 19:01:41: 1152MHz 1.77 0% 0% 0% 0% 0% 0% 31.2°C 0/8 19:01:46: 1152MHz 1.62 0% 0% 0% 0% 0% 0% 31.9°C 0/8 19:01:51: 1152MHz 1.49 0% 0% 0% 0% 0% 0% 31.2°C 0/8 19:01:56: 1152MHz 1.37 0% 0% 0% 0% 0% 0% 30.9°C 0/8 Time CPU load %cpu %sys %usr %nice %io %irq CPU C.St. 19:02:01: 1152MHz 1.26 0% 0% 0% 0% 0% 0% 32.5°C 0/8 19:02:07: 1152MHz 1.16 0% 0% 0% 0% 0% 0% 30.1°C 0/8 19:02:12: 1152MHz 1.07 0% 0% 0% 0% 0% 0% 29.9°C 0/8 19:02:17: 1152MHz 0.98 0% 0% 0% 0% 0% 0% 33.5°C 0/8 19:02:22: 1152MHz 0.90 0% 0% 0% 0% 0% 0% 31.0°C 0/8 19:02:27: 1152MHz 0.83 0% 0% 0% 0% 0% 0% 28.6°C 0/8 19:02:32: 1152MHz 0.76 0% 0% 0% 0% 0% 0% 31.5°C 0/8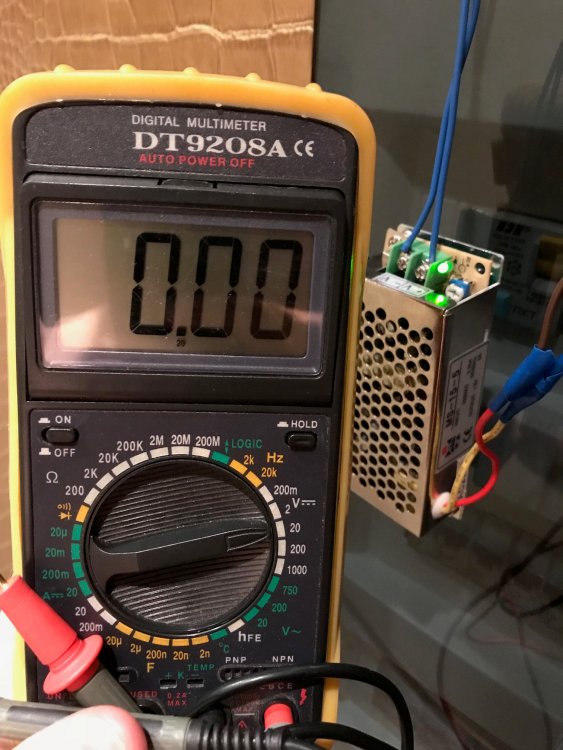
-
-
5 minutes ago, tkaiser said:
Which HDD are you using (it's important since different brands behave differently wrt undervoltage)
SSD Samsung 850 Pro 512 Gb (...please don't remind me about "hunting squirrel with a howitzer"). Did no try to search deep, but official specification (https://www.samsung.com/us/system/consumer/product/mz/7k/e2/mz7ke256bw/850PRO.pdf) says (for "active" state) V = "5", Power = 3.5W (5Vx0.75A, as i assume); ok, let them lie and it's 7.5W under load (5Vx1.5A); i have a USB-charger with 2.1A (let it lie too, and there are only 1.7-1.8A which is enough). BUT: i also do have a SATA2USB with"unknown power characteristics" (so, there are at least 2 points to measure Voltage/Amp: SATA OUT to SSD, USB-IN to SATA2USB) and first one is "not the easiest thing to measure"
8 minutes ago, tkaiser said:How do you really power your board? On the led strip PSU there's only a screw terminal. What is connected to this and how do the cable diameters look like?
PSU screw terminal <=> two thick wires taken from "standard black computer PSU power connector internals" <=> twist, covered with insulating tape <=> two a bit thiner (but thick enough) wires ended with 1.7mm jack (cut from 3A PSU). All wires are thick enough IMHO, but i agreed, that real voltage/amp level is a subject to check (potential losses / additional resistance in points of twist i hope are negligible because of "contact surface length" which is formed as ~10mm of "naked" wire from each side )
I will try to measure voltage and amperage under load, but it will take a while.
P.S. +I also ordered Odroid-HDR-HC1 (because i just want things to work) so, maybe OPiPrime will be added to my collection of "things that just does not work out-of-the-box as needed for me"
-
51 minutes ago, tkaiser said:
Feel free to waste your time further on this, I only answer in the hope that some of the 8 moderators in this forum later do what they originally wanted to do (some housekeeping to help users):
- 'usb 3-1: reset high-speed USB device number 2 using ehci-platform' this message tells you that USB controller 3-1 lost control to device 3-2 (that's your external JMS578). Usually this is the result of undervoltage, the external disk doesn't get enough voltage (which HDD do you use? Some of them start to get in trouble when voltage drops below 4.7V, some others are even fine with 4.4V), disconnects from JMS578's SATA PHY which in turn let the JMS578 disappear from the USB bus. Reduced consumption let's the voltage rise again, the disk reappears and so the JMS578 does
- In the meantime your filesystem is already corrupted (which is perfectly understandable if there are continous USB resets) so I would better check with 'btrfs scrub /home' now
- If you want to switch from trial&error mode into investigation mode you need a Multimeter to check voltage available on testpoints under load and in idle
- And if you want to solve the problem with an external disk that is not able to be powered on its own you need to provide a reliable power source able to provide a STABLE voltage and enough current (using those Y-cable and connecting them to two different power sources with different voltages available is nothing I would call 'stable power source')
Edit: Realized that this sounds all too harsh but I really just want you to stop wasting your time since it's really pointless. Even if OPi Prime is not supported it's IMO misleading to not tell you that you need a 3A PSU with stable voltage to do the next step. All of your symptoms are well known and with 99% probability underpowering related. So again it's pointless to spend any time on this before this common problem source is not eliminated.
@tkaiser Thanks, a lot of info, need to think about all you said.
-
11 minutes ago, tkaiser said:
And you can stop flooding this thread with more and more underpowering reports since it's pointless. I also have no idea why this thread is not already in the correct subforum.
Then move it to correct subforum, see no problem.
11 minutes ago, tkaiser said:And you can stop flooding this thread with more and more underpowering reports since it's pointless.
This is just your POW, nothing more, agreed ?
I really should "hide" those walls with quoting, but in fact, there was at least two ideas based on output: about external power supply for USB-HDD and "cpu underpowering => test with lower freq". This is "more then no support", so 1) thanks for all 2) walls are working.
And that's my opinion, and, as i guess, it does not contraversal to forum usage rules.
-
14 minutes ago, Igor said:
This was referring only to a quoted problem "armbianmonitor returns 500", while the rest is a low priority. Board kernel is still in the development phase which means there is no support/you are on your own if you try to use it.
I've already got it So, i try to do my best to solve my problems by myself with help of volunteered people around. -
ok, took latest with this commit (strange, but see no changes in this commit except "if-ing" & more strict checking to detect absence of temp-sensors, but doest not matter)
Anyway, crash with 1104MHz ( http://sprunge.us/cacb ). Reasonable to assume problems with my USB external case (thing i could test by myself)?... Will check in a couple of days.
@Igor So, unleashing 1152MHz (instead of previous max of 1108Mhz) does not look successfull yet. At least with my board
+more: with 1104MHz & current load (monerod & bitcoind with cpulimit 200+150) i could not even perform a login via ssh until it crashed ("key exchange timeout"), so, i suppose, it was a "real-life stress-test".
-
@Naguissa Max temp under load is not more then 50, usual range is ~44..48. Not too much IMHO, but need to see CPU specification (but lazy a bit ...
)
@Igor i've set 1.1Ghz via "userspace" governor to evaluate stability with low freq (and, therefore, voltage).
And, BTW, http://sprunge.us/ still returns 500, for example: http://sprunge.us/hUZM (i don't know is that yours or external service, but just informing)


HC-1: replaced zram as swap with partition and got swap error
in Odroid XU4
Posted
Returned zram swap back.
odroidxu4:~$  cat /proc/swaps
Filename				Type		Size	Used	Priority
/dev/zram0                              partition	127612	37156	5
/dev/zram1                              partition	127612	37172	5
/dev/zram2                              partition	127612	37128	5
/dev/zram3                              partition	127612	37132	5
/dev/zram4                              partition	127612	37136	5
/dev/zram5                              partition	127612	37096	5
/dev/zram6                              partition	127612	37028	5
/dev/zram7                              partition	127612	37108	5
Rebooted. And once again: